Discover how resilient organizations avoid the $400 billion dollar problem facing global businesses.
Customer Stories
Building digital resilience together
See how the most innovative organizations are driving value with Splunk.
CUSTOMER STORY
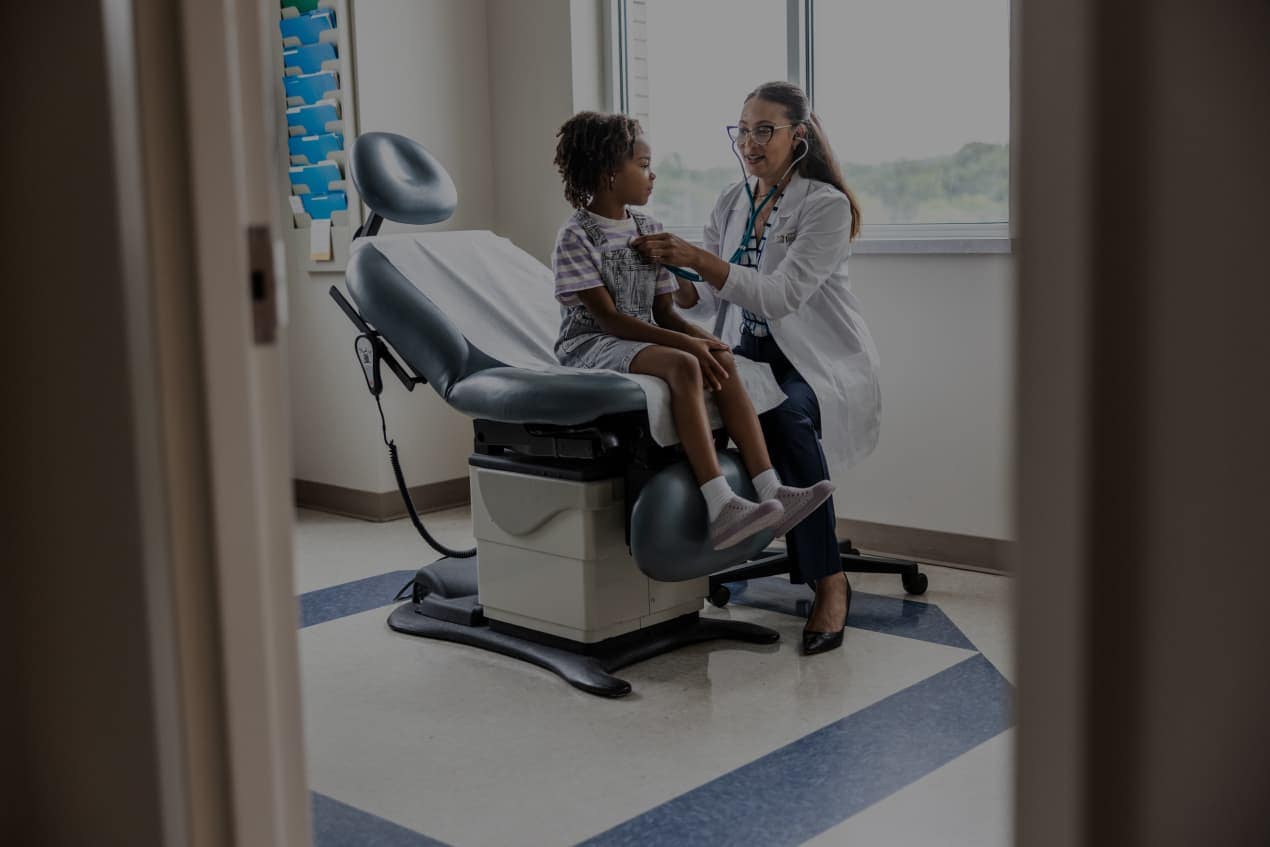
Children’s National Hospital Uses Splunk for TDIR
By bringing all that valuable telemetry into the Splunk environment, we gain the visibility needed to protect data, no matter where it lives.
40%
increased in detection of threats
25%
increase in analyst productivity

CUSTOMER STORY
Progressive Protects Customers and Revenue with Splunk
If we can show that monitoring was able to pick up prior to a service disruption, we’re able to show that the investments we make in the monitoring tool are giving the business value.
$120B
in market capitalization protected
8M
traces and 50M spans captured

CUSTOMER STORY
Singapore Airlines Elevates Customer Experience
With Splunk, Singapore Airlines can now find and fix issues faster — maximizing service uptime, optimizing customer experience, and keeping the brand’s reputation sky-high.
75%+
faster issue detection
90%
fewer backend issues

CUSTOMER STORY
Carrefour Responds to Security Threats 3x Faster
We get so much value from Splunk. It maximizes the insights we gain from analyzing detection use cases, rather than wasting time creating rules or struggling with a tool that’s too complicated.
3x
faster threat response times
€10B
($10.45B) projected in e-commerce sales by 2026

CUSTOMER STORY
Specsavers Sees 10x Faster MTTR with Splunk
Splunk has made every team's life easier.
100+ critical
and 500+ major incidents prevented in a single month
25,000 hours
saved monthly through automation initiatives