To build our own solution like what Splunk has would take someone too long. But we completed the Splunk dashboard in three or four days.
2xConnect Stays Agile and Reduces Downtime by 60% With Splunk Observability Cloud

A nimble startup with limited people power, 2xConnect needed an agile, end-to-end observability solution to maintain uptime and deliver better performance to customers.
With Splunk Observability Cloud, 2xConnect gained a single pane of glass view into their IT operations, infrastructure and security, allowing them to address issues faster and reduce downtime by 60%.
More uptime means better customer experience and increased revenue.
For B2B telemarketing startup 2xConnect, helping customers make connections is at the heart of their mission. The business is among the first to bring together data, dialing and voice in one solution so that their customers can reach more potential customers, be more productive and lower their costs. In fact, with the 2xConnect SaaS product, agents reach twice the number of prospects than the next provider.
But to achieve the number of daily calls agents need to make in order to meet their rigorous service-level objectives, 2xConnect needs to embed end-to-end observability into their infrastructure. The ability to isolate and resolve performance problems quickly correlates directly with their own customers’ success — and confidence in 2xConnect itself. And with a lean engineering team, they need something cost-effective to help them quickly identify and communicate issues across their entire production environment, without requiring a lot of people power.
With previous vendors, 2xConnect was struggling to get end-to-end observability and integrate the platform smoothly into the rest of their tech environment. Then they found Splunk. The comprehensive solutions available with the Splunk Observability Cloud — including application monitoring, real user monitoring (RUM) and cloud logging — exceeded their expectations.
Outcomes
60%
less downtime, leading to improved customer experience
100%
uptime during AWS migration, ensuring consistent customer revenue and experience
20%
improvement in revenue conversion after a critical bug was discovered
Dialing into full-stack observability with a single dashboard
Numbers mean a lot at 2xConnect. It makes sense; there are about 1,000 agents making calls every day using the platform, and partners like ZoomInfo help deliver on the company’s promise to enable twice the number of conversations with prospects around the globe.
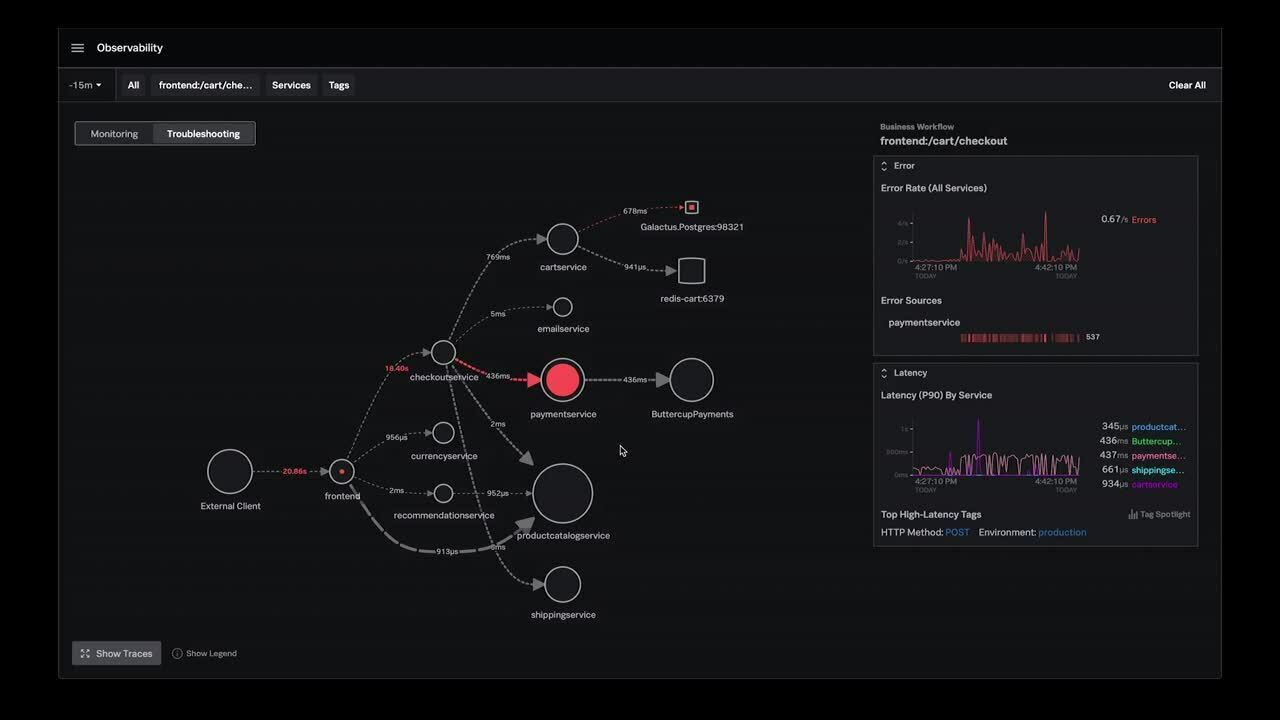
So it was imperative for the different teams at 2xConnect to see into the company’s data — all of it. “The numbers we look at are extremely important,” says Chief Technology Officer Sushant Prasad. “Any time KPIs are impacted, our business is impacted and our customers are impacted. We have attrition and loss of confidence.” With Splunk Observability Cloud, the team was able to create a single dashboard to see all those numbers. Not only log alerts, security-related monitoring and a real-time view of the agents’ call systems — but also business KPIs, so both leadership and operations teams could view a single source of truth for their business data.
“To build our own solution like what Splunk has would take someone too long. We wouldn’t have been able to do it with a company our size,” Prasad says. “But we completed the Splunk dashboard in three or four days thanks to out-of-the-box templates.”
The out-of-the-box templates weren’t just easy to build and add onto, they were easy to use. Such clarity made issues simple to spot, such as when just three days into using Splunk, CEO Manish Panjiar noticed an odd drop in the number of initiated calls that were taking place. The engineering team was able to detect a bug in the code that had been impacting 2xConnect for at least nine months, reducing revenue all the while. “Without Splunk’s dashboard and the full-fidelity data, we wouldn’t have even realized the problem existed,” Prasad says. But they were able to detect and resolve the problem, a fix that improved revenue conversion by 20%.

Staying agile and secure with easy integrations
As a startup with limited resources, 2xConnect stays nimble and builds software faster by using open source and open standards. So Splunk’s native OpenTelemetry support within Observability Cloud was a big plus. “Philosophically, we like to work with open source so we can use what’s out there,” says Prasad. “But open source is also part of our company ethos because we want to contribute back to the industry, too.”
The many integrations available for the Splunk Observability Cloud helped 2xConnect work organically within their existing tech and stay agile and secure as they grow, even when completing typically complex projects, like migrating databases. When transitioning from Heroku to AWS, for example, 2xConnect relied on their trusty dashboards to maintain 100% uptime and ensure customers were never affected by their internal switch.
The integrations between Splunk, Slack and Opsgenie worked well for them, too. Opsgenie alerts are routed straight to Slack, so operations, tech and support teams can quickly respond to any issues. “Splunk was actually our entry point to the whole team moving to Slack,” reflects Prasad. “Now our MTTR is much faster.”
Without Splunk’s dashboard and the full-fidelity data, we wouldn’t have even realized a revenue-threatening code issue existed.
Never phoning it in
As 2xConnect continues on the quest to be a top provider, the team is excited to experiment with Splunk’s other solutions in the Observability Cloud that will help them continue to develop an even more robust product and deliver even better customer experiences. On the immediate horizon? Previewing Splunk Synthetic Monitoring. 2xConnect hopes to be able to use synthetics to monitor product performance, taking into consideration different geographical locations between end users and service providers — another set of numbers that Splunk Observability Cloud will help parse to fuel growth.