
Solve problems in seconds with the only full-stack, analytics-powered and OpenTelemetry-native observability solution.
solution
Bind tools into a self-service experience
Get your costs under control
Eliminate swivel chair troubleshooting and foster collaboration for faster MTTR with a single source of truth.
Elevate the developer experience
Enterprise-grade cost and usage controls to extend observability to more environments without expanding costs.
Speed up onboarding and beyond
OpenTelemetry instrumentation and pre-built content out of the box to standardize on best practices.
Enterprise and granular controls to set guardrails
Splunk offers budget stability with usage and consumption controls so you can easily track and forecast costs as you scale. Role-based access controls (RBAC) and Access Tokens ensure you get fine-grained control over your users and data usage.
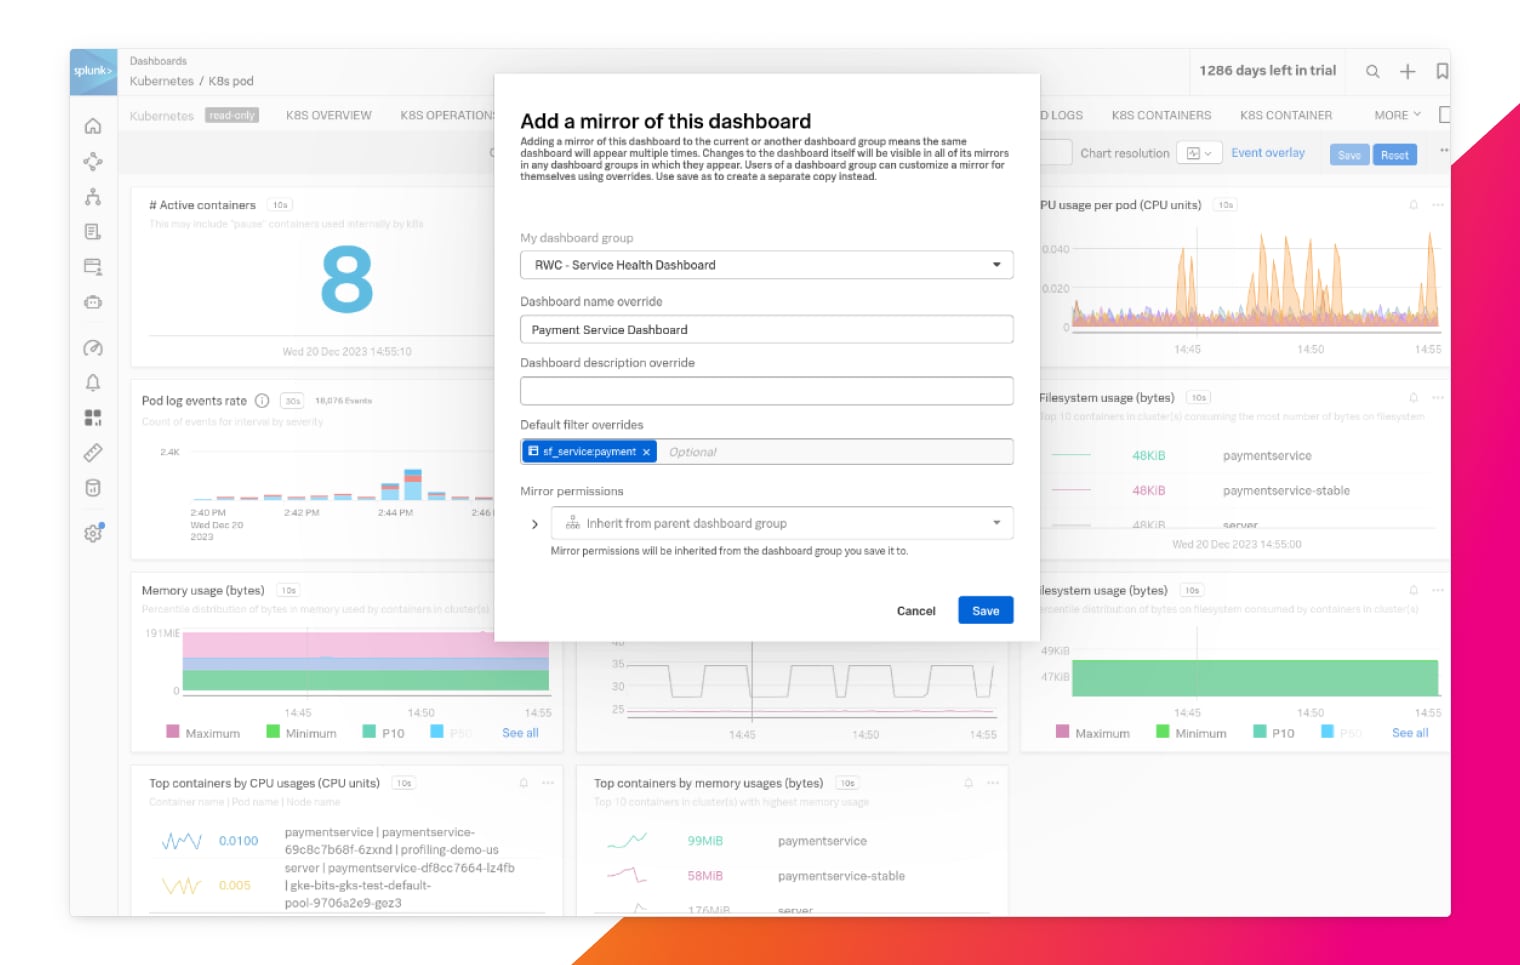
Improve productivity with templates and observability-as-code
Engineers get things done faster with Splunk. Use Mirrored Dashboards to copy and reuse previously created observability charts, dashboards and detectors. Splunk Terraform support helps you automate changes in the software and quickly onboard dashboards and detectors.
To build our own solution like what Splunk has would take someone too long. We wouldn’t have been able to do it with a company our size, but we completed the Splunk dashboard in three or four days thanks to out-of-the-box templates.

Built-in content and OpenTelemetry instrumentation to standardize on best practices
Splunk is 100% OpenTelemetry native and supports Infrastructure-as-Code so you can instrument once, standardize on deployments and reduce toil as you scale. Additionally, pre-built content based on best practices enables seamless onboarding and knowledge sharing.