Improve hybrid cloud performance with instant visibility and real-time alerts.
OVERVIEW
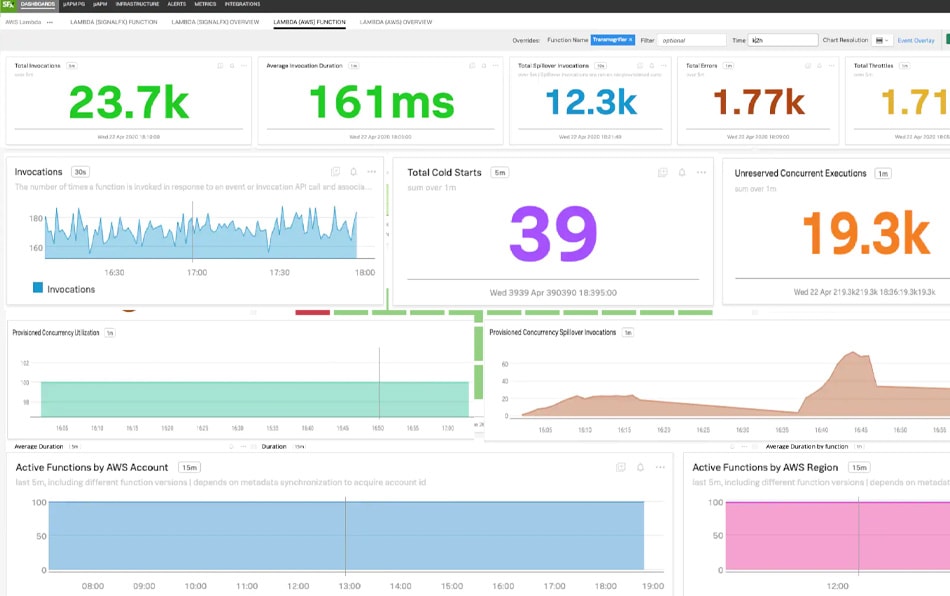
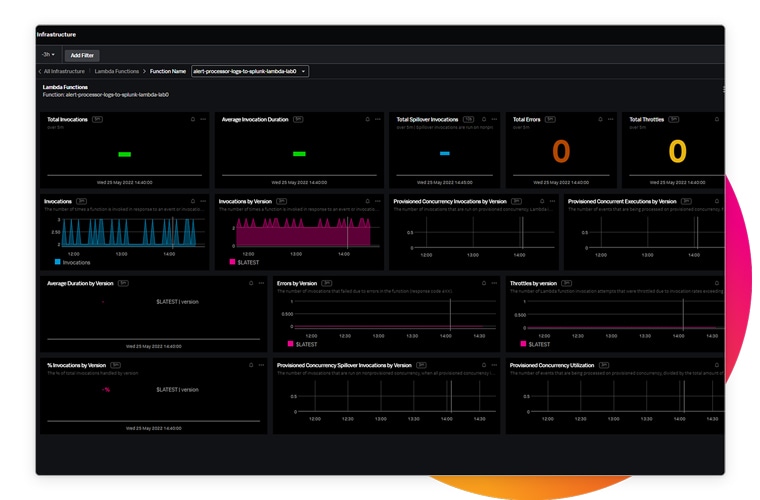
Real-time serverless monitoring
As more organizations adopt serverless architecture, observability into these environments is increasingly essential. From AWS Lambda and Google Cloud Functions to Microsoft Azure Functions, Splunk accelerates monitoring with pre-built dashboards for critical function metrics and performance data — at one-second resolution with Splunk Infrastructure Monitoring function wrappers.