Tap into AI-guided insights
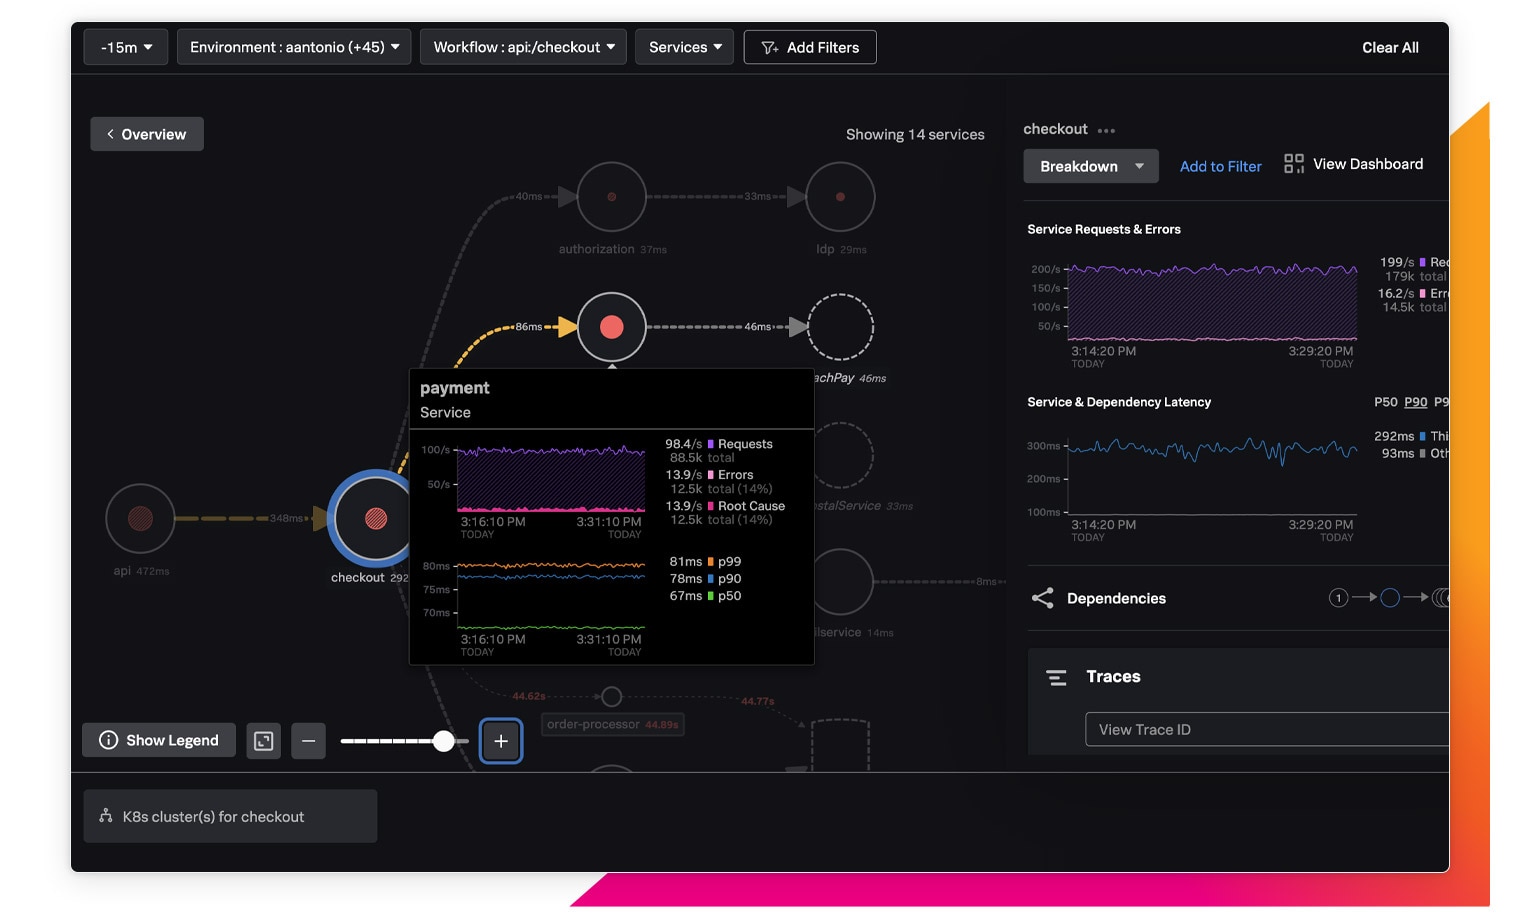
In an environment with tens or hundreds of microservices, it’s hard to know which one is causing an issue. Splunk APM gives you the power to identify the problematic service at a glance with AI-guided insights.
Observability
Spot any issue that impacts important business KPIs and accelerate MTTR by combining all the related data in intuitive visuals.
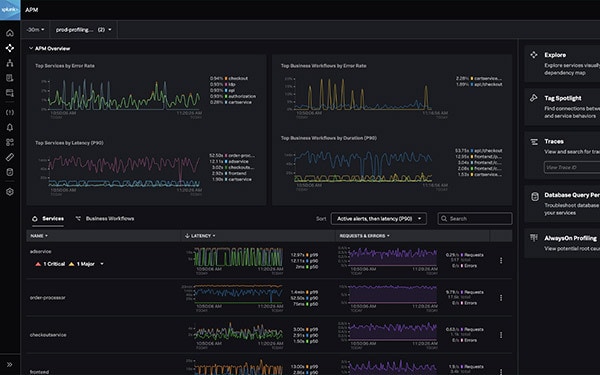
As part of Observability Cloud, Splunk APM provides you with all the application, infrastructure, front-end, and log data you need to quickly identify the root cause of any issue.
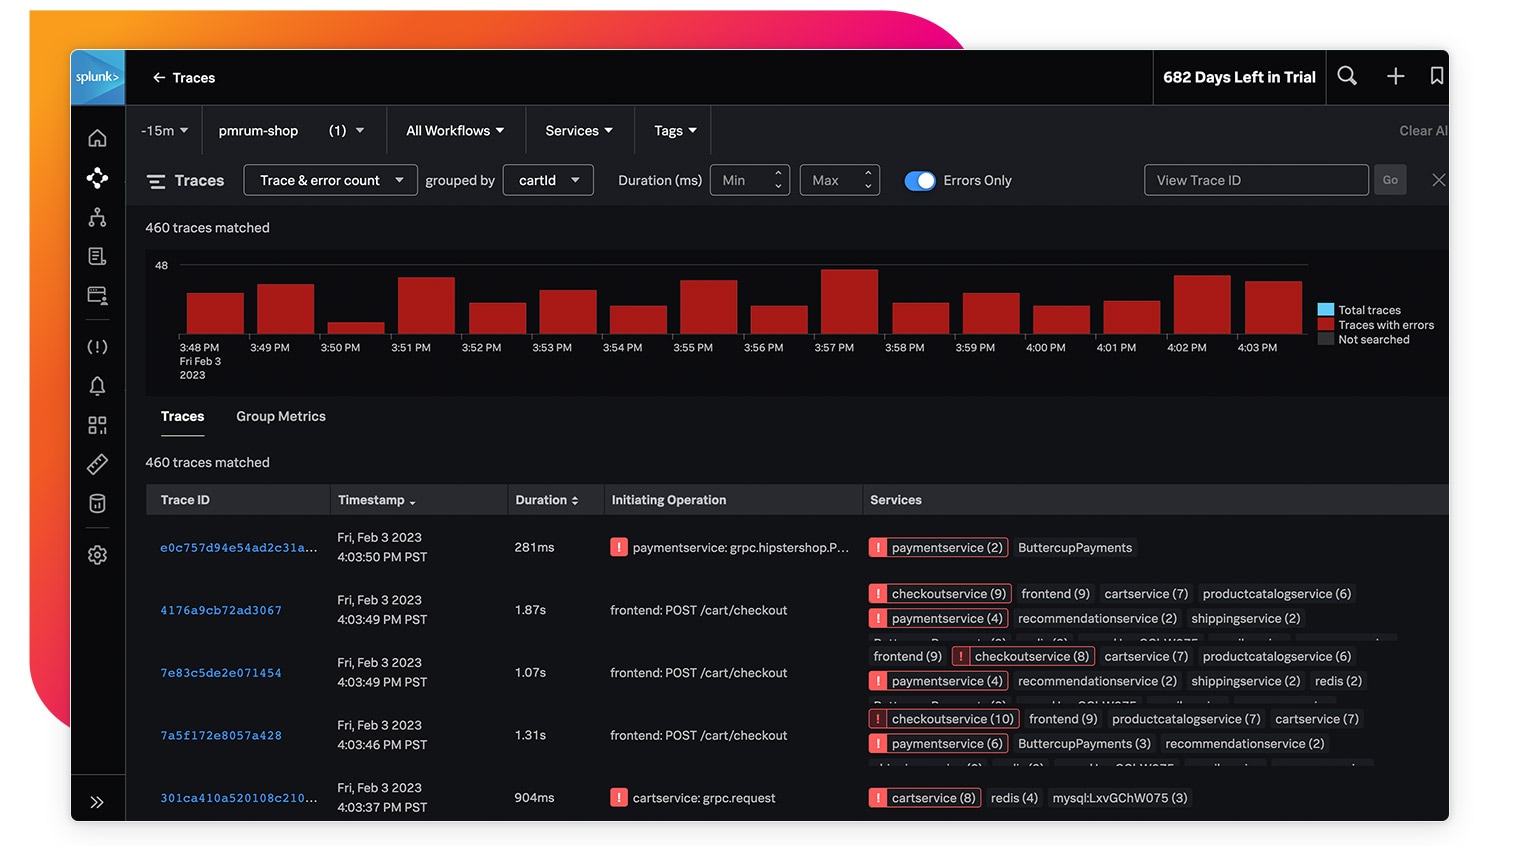
Identify the problematic service at-a-glance with automatically generated solid red dots that highlight the service at the root cause of an issue.
Immediately identify what problematic traces have in common, whether it’s infrastructure, code, or business logic.
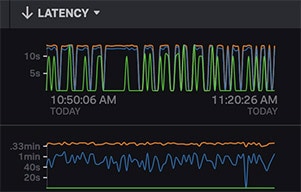
With 100% of traces stored, search for any trace based on any combination of their tag values, errors, or latencies.
Continuously monitor CPU and memory consumption of code written in Java, .NET and Node.js with built-in code profiling.
Troubleshoot faster with built-in correlation of trace, profiling, infrastructure metrics, and log data.
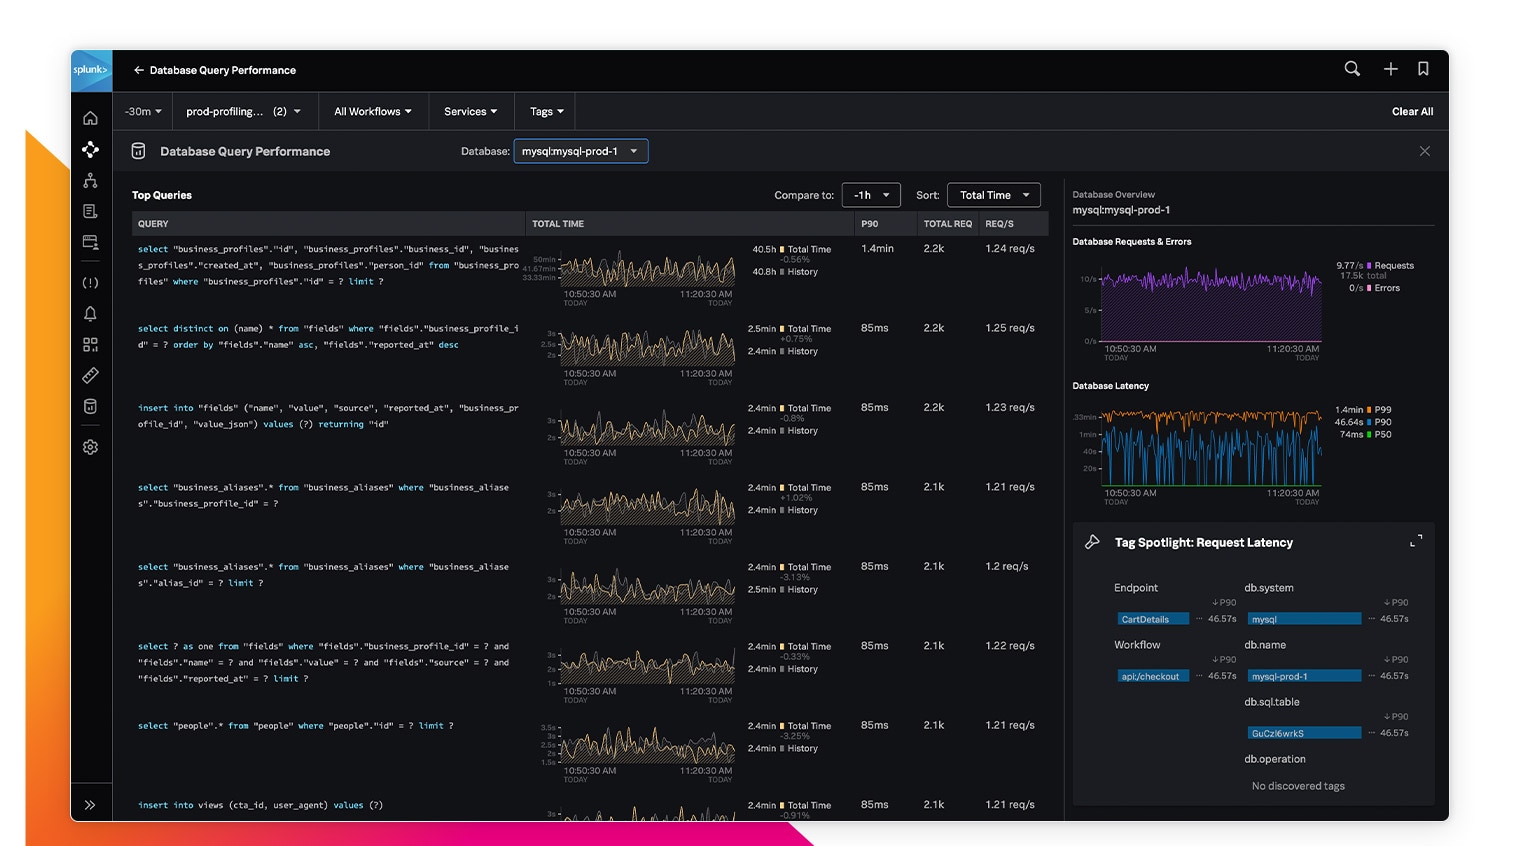
Receive alerts on slow response times or problematic queries for commonly used databases.


If we can show that monitoring was able to pick up prior to a service disruption, we’re able to show that the investments we make in the monitoring tool are giving the business value.
The only full-fidelity, end-to-end visibility solution for end-user experience.
Log analysis across your cloud-native application and cloud environments.
The only real-time, analytics-driven multicloud monitoring solution for all environments.
Go beyond basic uptime and performance monitoring for better digital experiences.
Empower teams by routing alerts to the right people for fast collaboration and issue resolution.
Observe and secure your hybrid and on-prem applications across every environment.
© 2005 - 2026 Splunk LLC All rights reserved.