false
shared header v2
Lucid Search Bar Implementation
Push Down Banner V1 Analytics Patch, remove after implementing V2 (S9 or S10)
Global nav V2 patch, remove after adding the mobile languages fix in the codebase (S7 or S8)
transitional logo header/footer patch

USE CASE

OpenTelemetry and Splunk

Capture, generate and export telemetry data into observability tools for comprehensive software performance and behavior analysis.

open telemetry
Overview

What it is

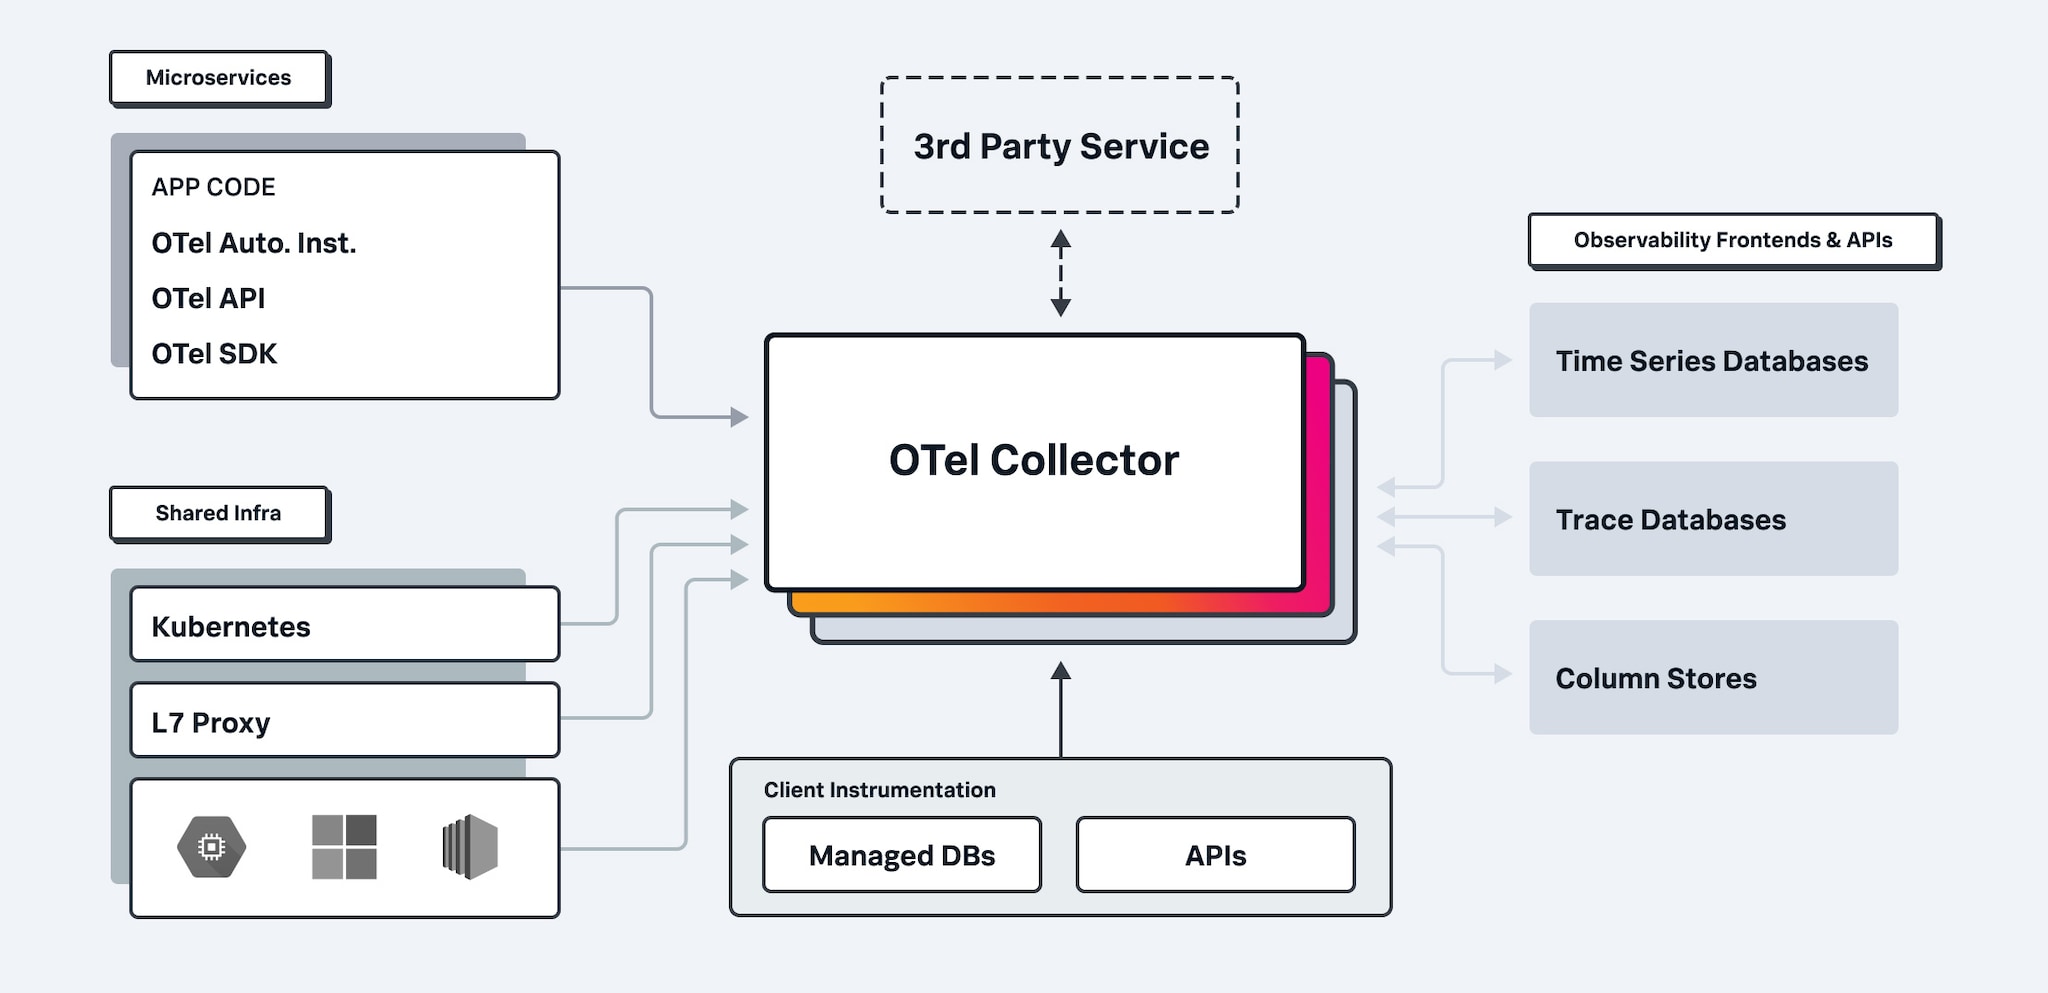
OpenTelemetry is a collection of tools, APIs and software development kits (SDKs). Use it to instrument, generate, collect and export telemetry data (metrics, logs and traces) to help you analyze your software’s performance and behavior. 

Why it matters

Democratizing data gives you the power to choose the platform with the most insight and value. With end-to-end structure, status and application performance visibility, you can highlight the root causes of errors or identify performance issues enterprise-wide.

Where it's going

The OpenTelemetry community is growing. As a joint project between Splunk, Google, Microsoft, Amazon and many other organizations, it currently has the second-largest number of contributors in the Cloud Native Computing Foundation after Kubernetes.

HOW WE HELP

opentelemetry marchitecture

Built-in standard for observability

From distribution of the OpenTelemetry Collector, OpenTelemetry Java, Node.JS, .NET and Python client libraries, and instrumentation packages or SDKs from hundreds of commonly used frameworks, Splunk supports automatic trace instrumentation and configuration to make it easy to get started. Plus, you can customize what's included by building from the community source.

Powering end-to-end observability

View the status, interactions, dashboards and logs from all of your infrastructure in Splunk Observability Cloud or other observability tools. You can use OpenTelemetry to capture traces, metrics and logs from OpenTelemetry SDKs on the same host or over the networks, or from hundreds of sources, including databases, network proxies, Prometheus and Jaeger and more.

Improve performance Improve performance

Improve performance

Maintain vendor neutrality and optimize performance of revenue-generating applications by addressing failure conditions.

Centralize your data Centralize your data

Centralize your data

Capture data from all sources with a single agent using the OpenTelemetry Collector — without sacrificing choice. Use open standards and easy instrumentation.

Integrate with ease Integrate with ease

Integrate with ease

Use an array of languages, frameworks and libraries to manage all your integrations.

Troubleshoot faster Troubleshoot faster

Troubleshoot faster

Tackle performance issues quickly and reduce mean time to resolution (MTTR) with context-aware workflows powered by metrics, traces and logs.

Splunk makes it easy to get started with OpenTelemetry

open telemetry gif

Splunk Advantage

Supported by Splunk

Splunk offers a preconfigured and fully supported distribution of the OpenTelemetry Collector; which supports automatic (no code modification) trace instrumentation and comes with default configuration and out-of-the-box support for Splunk Application Performance Monitoring and Splunk Infrastructure Monitoring — making it easier than ever to get started.

easy to get started easy to get started

Easy to get started

Unlike other vendors that “support OpenTelemetry” but still encourage you to use their proprietary agents, we are OpenTelemetry-native. We have built Splunk Observability on top of OpenTelemetry, so no matter your instrumentation or data collection agent, you can pull in your data with ease. 

Read the Blog
Splunk distribution of OpenTelemetry Collector Splunk distribution of OpenTelemetry Collector

Splunk distribution of OpenTelemetry Collector

The Splunk OpenTelemetry Collector Distribution supports automatic (no code modification) trace instrumentation and comes with default configuration and out-of-the-box support for Splunk Application Performance Monitoring and Splunk Infrastructure Monitoring — making it easier than ever to get started. 

Learn More About Splunk Support
Top contributor to the OpenTelemetry project Top contributor to the OpenTelemetry project

Top contributor to the OpenTelemetry project

Splunk is committed to the advancement of the OpenTelemetry project. We have a team of 20+ engineers on a dedicated OpenTelemetry team that has made over 100,000 contributions and counting. Get involved in the conversation on the CNCF Slack or join a special interest group.

Check Out Github
acquia background acquia background

CUSTOMER STORY

Care.com Refactors Monoliths Into Microservices With Splunk Observability

We could bake OpenTelemetry into our architecture from day one because we have Splunk, who is the number-one contributor to OpenTelemetry and way ahead of the curve on this.

Sean Schade, Principal Architect, Care.com

RELATED PRODUCTS

One platform for all your observability needs

RESOURCES

Explore more from Splunk

How to Get Started with OpenTelemetry

Discover how easy an open standards approach can be.

Watch the Webinar

Get started

Consolidate tools, optimize spend and uncover open standards advantages.