IT Event Analytics Guide
Be proactive. Manage alerts. Predict outages before they impact your customers, with event analytics.

Key takeaways
Every action within an organization’s infrastructure leaves a digital footprint — this is an IT event. It could be a routine login, a system update, or an unusual spike in network traffic.
As a result, IT teams have to deal with an overwhelming volume of logs and alerts which makes it nearly impossible to catch real threats. Event correlation solves this by identifying patterns across logs and helping teams detect security risks faster.
In this article, we’ll understand IT events and see how correlating them can help you stay ahead of threats.
IT events are the online footprints of every action or process that occurs within a network or system. Enterprises generate 402.74 million terabytes of data daily, much of which comes from IT event logs. Pretty much everything produces event logs:
Each event is recorded in a log file, essentially a detailed ledger of system activity. For example, if you access a company’s database, its system will log details of when, how, and where the access occurred.
(Related reading: MELT telemetry data includes metrics, events, logs, and traces.)
Event correlation is a foundational activity for all digital practices: IT and network operations, IT service management, pub/sub and certainly cybersecurity. NIST defines it like this:
IT event correlation is “finding relationships between two or more log entries.”
The information that comes from correlating events gives teams a lot to work with. The flip side, however, is that there’s often too much information.
Your IT and security teams handle large volumes of logs and alerts daily which makes it hard — sometimes impossible — to identify related events. They may miss critical connections. Threats may go undetected.
That’s why modern event correlation tools use automation, ML, and AI to pinpoint the few events that are critical. (It’s not unlike finding the needle in the haystack.) Event correlation solutions can help to:
In 2023, researchers developed a hierarchical event correlation model to address this issue, correlating events before intrusion detection systems (IDS) could classify them. After implementing this model, they saw an 87% reduction in alert data, saving security teams from alert fatigue.
Splunk IT Service Intelligence (ITSI) is an AIOps, analytics and IT management solution that helps teams predict incidents before they impact customers.

Using AI and machine learning, ITSI correlates data collected from monitoring sources and delivers a single live view of relevant IT and business services, reducing alert noise and proactively preventing outages.
Correlating events is useful in several IT domains. Here’s a brief look at how the whole IT event correlation process works:
Though event correlation is important across IT networks and IT services, it’s particularly important in certain cybersecurity solutions, like SIEM. It’s in the name: security information and event management (SIEM) is a cybersecurity solution that provides a single, streamlined view of your data, insight into security activities, and operational capabilities so you can stay ahead of cyber threats.
For example, one failed login attempt — which is a single event — may not raise any red flags. However, when a SIEM system correlates this one failed login with other, multiple failed attempts across different accounts or IP addresses, it can uncover an attack in progress.
This way, SIEM systems provide insights into security incidents that could go unnoticed — and it begins with event correlation.
(Splunk is an industry-leader in SIEM. Learn more about Splunk Enterprise Security.)
Let’s see the different ways IT event correlation analyzes relationships between events to identify issues and improve system performance.
Rule-based correlation relies on predefined rules to link events. For example, if a server's CPU usage spikes and a network latency event occurs simultaneously, a rule can correlate these two as related.
This technique works well when event relationships are clear and predictable. However, it requires ongoing maintenance to ensure rules stay relevant as systems evolve.
Time-based correlation links events that occur within specific timeframes. A security breach may involve first a failed login attempt followed by unusual system behavior minutes later.
We can group such events by time to find sequences that indicate issues. However, it can miss connections that span longer periods or occur irregularly. Such unaddressed issues can escalate to unplanned outages — and this downtime hits your revenue the hardest.
Pattern-based correlation identifies recurring patterns in event data. It analyzes historical logs to flag patterns such as repeated access attempts to restricted files.
This correlation predicts and prevents future incidents. However, setting it up requires:
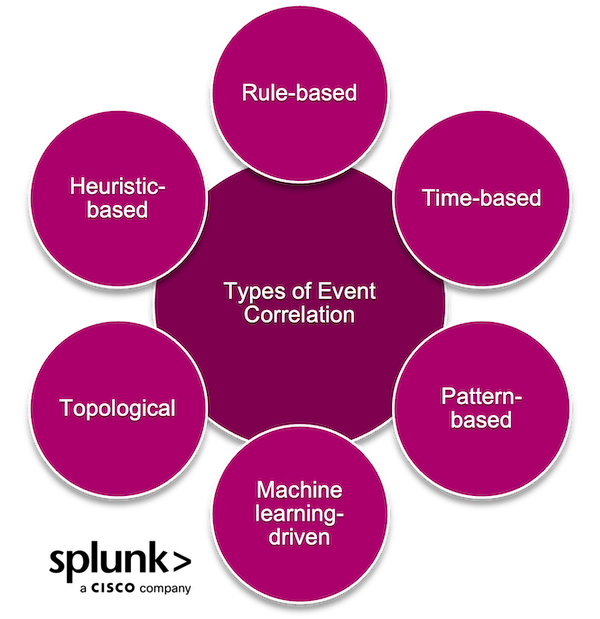
AI-driven event correlation uses ML and cluster analysis to detect and predict event sequences by distinguishing between normal and abnormal events. This process is treated as a multi-class classification problem, where anomalies are identified using unsupervised or semi-supervised learning.
Topological correlation connects events based on system relationships. If a network switch fails, it may trigger alerts across connected devices. However, this approach would narrow down the root cause of such issues by mapping dependencies. It is especially valuable in environments with tightly integrated systems but requires detailed topology mapping.
(Related reading: what is network topology?)
Heuristic correlation uses experiential knowledge and approximations to identify links. Repeated error codes can indicate a systemic configuration issue.
While less precise than other techniques, heuristics provide quick insights, especially if you have limited data.
Event correlation handles many critical challenges that organizations face in managing complex systems. Without it, these issues can create inefficiencies. Let’s see how:
Modern systems generate massive amounts of data — 149 zettabytes were generated in 2024. Manually sifting through this data to identify patterns would consume a lot of time and require extensive expertise.
Event correlation filters out irrelevant noise and connects meaningful events to reduce this burden. This way, IT and security teams can focus on insights that matter rather than being overwhelmed by raw data.
IT environments include a variety of tools, applications, and devices that produce independent data streams. When these sources aren’t integrated, they create silos that prevent teams from seeing the bigger picture. And these silos impose a massive $3.1 trillion annual cost on the global economy.
Event correlation consolidates this fragmented data and identifies relationships across systems to provide a unified view of system activity and save extra costs.
A single issue, such as a server outage, can generate a cascade of alerts across the system. Without proper correlation, pinpointing the root cause in a flood of notifications is time-consuming and inefficient. Event correlation untangles these dependencies so teams can identify and address the underlying problem.
Many system failures are preceded by subtle warning signs that can easily be overlooked when events are treated in isolation. Event correlation connects the dots between historical and real-time data to spot these early indicators. This enables proactive measures that prevent incidents before they escalate.
While event correlation provides advantages, it also poses certain challenges. These obstacles can impact how effectively organizations implement and benefit from event correlation systems.
False positives. Event correlation systems may produce false positives by flagging benign activity as a potential issue. In fact, one-third of cybersecurity professionals say false positives account for up to 20% of incident alerts (that means one out of every five alerts is false).
Skill gaps. Employees must have expertise in data analysis and IT infrastructure know-how to implement and manage event correlation tools. However, many organizations lack in-house expertise to handle these demands. And this shortage will increase with time — IDC predicts that by 2026, more than 90% of organizations will face IT skills shortage.
Regulatory compliance. In industries with strict regulatory requirements, like finance and healthcare, event correlation tools must align with data privacy and security compliance standards.
However, ensuring compliance while managing vast amounts of sensitive data can be a complex and resource-intensive process when rules are different across regions and industries.
You must invest in scalable correlation systems that can integrate with existing workflows. This will help you enjoy the full potential of event correlation and improve your IT operations.
See an error or have a suggestion? Please let us know by emailing splunkblogs@cisco.com.
This posting does not necessarily represent Splunk's position, strategies or opinion.

The world’s leading organizations rely on Splunk, a Cisco company, to continuously strengthen digital resilience with our unified security and observability platform, powered by industry-leading AI.
Our customers trust Splunk’s award-winning security and observability solutions to secure and improve the reliability of their complex digital environments, at any scale.

Get the latest articles from Splunk straight to your inbox.
© 2005 - 2025 Splunk LLC All rights reserved.