SPLUNK OBSERVABILITY CLOUD
Any environment, any scale
Gain complete visibility and understand the impact of disruptions with real-time troubleshooting and guided root cause analysis. Splunk Observability Cloud helps eliminate the guesswork, so you spend less time firefighting and more time innovating.
- Progressive protected over $120 billion in market capitalization — without sacrificing compute performance — through full-fidelity tracing.
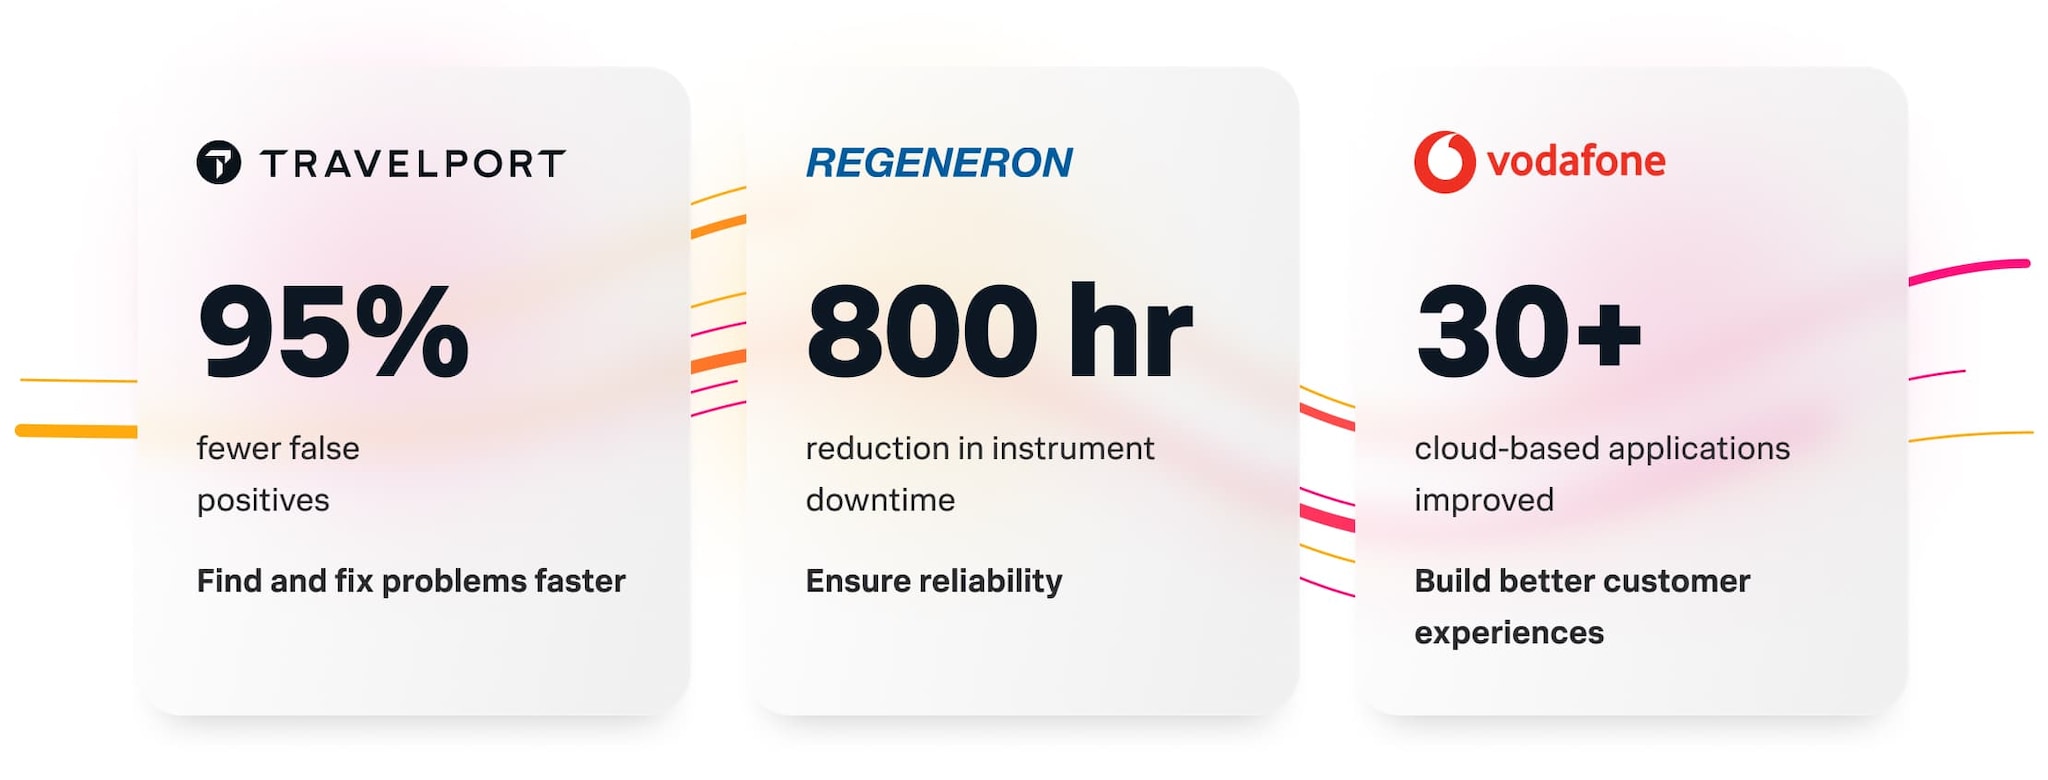
- Travelport reduced false positives by 95% and exceeded uptime goals, lifting customer experience to new heights.
- Sansan, Inc. achieved 100% visibility across its systems and services, even during peak transaction periods.
SPLUNK IT SERVICE INTELLIGENCE
Work smarter, not harder
Intelligence at your fingertips. Splunk’s got ITOps covered with AI-driven alert noise reduction, root cause analysis, and response — helping you predict and prevent performance problems and align IT workloads with business goals.
- Molina Healthcare reduced MTTR by 63% to bolster the continuity of critical healthcare services.
- Engie established adaptive thresholds to find and fix problems before they impact user experience.
SPLUNK APPDYNAMICS
Application performance, perfected
Flawless digital experiences boost your bottom line. Effortlessly monitor and track real-time performance metrics — and correlate them with business outcomes.
- Royal Caribbean cruised to success by avoiding $1M per hour in downtime costs.
- United Airlines resolved system issues in half the time to keep customer satisfaction flying high.
- Vodafone Italia improved user experience by enhancing the performance of 30+ cloud-based applications.
SPLUNK CLOUD PLATFORM
Big data, bigger insights
Flexibility at its finest. Splunk unifies observability and security in a single platform to tackle any data demands. Search, analyze, visualize, and act in real time to detect and prevent disruptions.
- Rent the Runway cut MTTR by 94% and prevented unplanned downtime for a stellar customer experience.
- Regeneron reduced instrument downtime by 800 hours, creating life-changing medicines faster and more efficiently.


