
New Report: Observability Platforms
Get the 2025 Gartner® Magic Quadrant™ for Observability Platforms for free.
Key takeaways
As organizations rely more on complex IT systems and cloud-based services, keeping everything running smoothly — and reliably — has become a top priority. That’s where IT service performance monitoring comes in, giving teams the visibility they need to make sure systems stay healthy and responsive.
By tracking a range of technical and user-focused metrics, businesses can quickly identify and address issues before they impact operations or end users.
In this article, we’ll explore what IT service monitoring is, why it’s essential, and the key practices and technologies shaping its future.
IT service performance monitoring refers to the process and technologies used to track, measure, and analyze the health and performance of IT systems — including both services and the infrastructure supporting them. It’s especially important in cloud environments, where organizations often have less visibility and control than they do with traditional, on-premises setups.
To make sense of it all, teams measure key performance indicators (KPIs) and compare them to predefined service level agreements (SLAs), as well as market trends and user expectations. Performance monitoring covers everything from applications running at the top of the stack down to the underlying infrastructure. By collecting and analyzing a mix of metrics, organizations can get a complete picture of system performance, availability, and reliability.
Service performance monitoring is particularly important in setting up a software development lifecycle (SDLC) pipeline — especially in modern engineering frameworks such as DevOps in cloud-based environments. Monitoring technologies collect log data from network nodes as well as the services and applications running on that network infrastructure. IT organizations use this information to analyze the changing states of:
With this information, DevOps organizations can plan and manage resources for containerized workloads much more effectively. It helps produce a documented audit trail for compliance with security and financial policies. Real-time SLA metrics are evaluated to help understand the true user experience.
Service performance monitoring not only covers technical metrics — it also provides a vital bridge between IT operations and business objectives. With the shift to cloud computing and SaaS, organizations must adapt their monitoring strategies to handle dynamic environments where direct control over infrastructure is reduced, making data-driven visibility more critical than ever.
Some of the key measurement categories and metrics for IT service performance monitoring include the following:
To assess availability and reliability in IT service performance monitoring:
Availability is often calculated as a percentage of uptime over a given period. Reliability is crucial as hardware and software both degrade over time, which can impact end-user experiences. High reliability and rapid detection/repair are key to maintaining strong SLAs.
Latency measures the delay between the request and its execution. Response time adds the processing time to latency, measuring how fast an end-user receives the response to a request. Throughput indicates the total capacity of the network. It limits the number of requests that can be handled by the network simultaneously, which determines how many (concurrent) users can request a service and the time taken to respond to all requests at any given time instant.
Throughput and latency are critical for understanding whether applications can scale to meet user demand without sacrificing performance. Application monitoring tools provide granular visibility into:
(Related reading: application performance monitoring.)
Bandwidth determines the maximum data transfer capacity of the network, and is used together with latency, throughput, errors and jitter (noise) to determine network performance. Percentage utilization rate is used for resource management, especially when planning for peak utilization or optimizing workload distribution during peak hours.
Network errors, jitter, and packet loss are additional metrics that can indicate connectivity or quality issues, potentially affecting application performance and user satisfaction.
Cloud services are billed based on usage. Service Performance monitoring tools measure a variety of metrics according to the price model and SLA agreement. Common metrics include CPU utilization, task completion time, the number of virtual machines and disc I/O.
Other important cloud metrics include storage consumption, API response times, and cost monitoring to avoid unnecessary spending. Cloud-native monitoring solutions often provide automated scaling and alerting as resource thresholds are approached or exceeded.
Concurrency measures how many active users or processes interact with your systems simultaneously. Requests per second or transactions per second measure the capacity of the system to serve a concurrent user base. When these metrics are exceeded, end-users may experience issues such as queuing, timeout, errors, and failed service requests.
Monitoring user experience also involves tracking session times, error messages, page load times, and customer satisfaction scores to ensure the IT environment is meeting end-user expectations.
The goal of modern SDLC frameworks is to deliver high quality software over rapid, frequent and continuous release cycles. Metrics such as deployment frequency, change failure rates and lead time for change help evaluate business performance of the DevOps SDLC technology pipeline. These metrics may not be measured directly from the service performance monitoring tooling but are used in conjunction with the measured metrics to enable data-driven decision making.
By correlating deployment metrics with system performance, organizations can quickly identify how new releases or changes impact service health and customer experience.
SLA violations occur when the service performance falls below the agreed threshold as per the contractual agreement. A service performance monitoring tool may be programmed to track such violations, which can later help renegotiate or update the SLA terms.
Continuous tracking and automated alerting on SLA breaches enable IT teams to take corrective actions before contractual penalties or reputational damage occur.
Business organizations are always on the lookout for ways to improve the performance, reliability and security of their technology systems. A complex enterprise IT environment can quickly turn into a cost-center when the systems and operations are not monitored in real-time. Issues such as over-provisioning (and therefore overbilling) for under-performing systems that violate SLAs may go unnoticed without proper monitoring.
These issues should be identified proactively, instead of reactively. Tools such as predictive analytics do just that — using mathematical models and advanced machine learning algorithms to process large volumes of information, transforming raw contextual data into actionable insights and knowledge.
Proactive monitoring and predictive analytics help organizations anticipate failures, optimize resource allocation, and manage costs. This ensures a seamless user experience and protects the business from downtime, security incidents, and unexpected expenses.
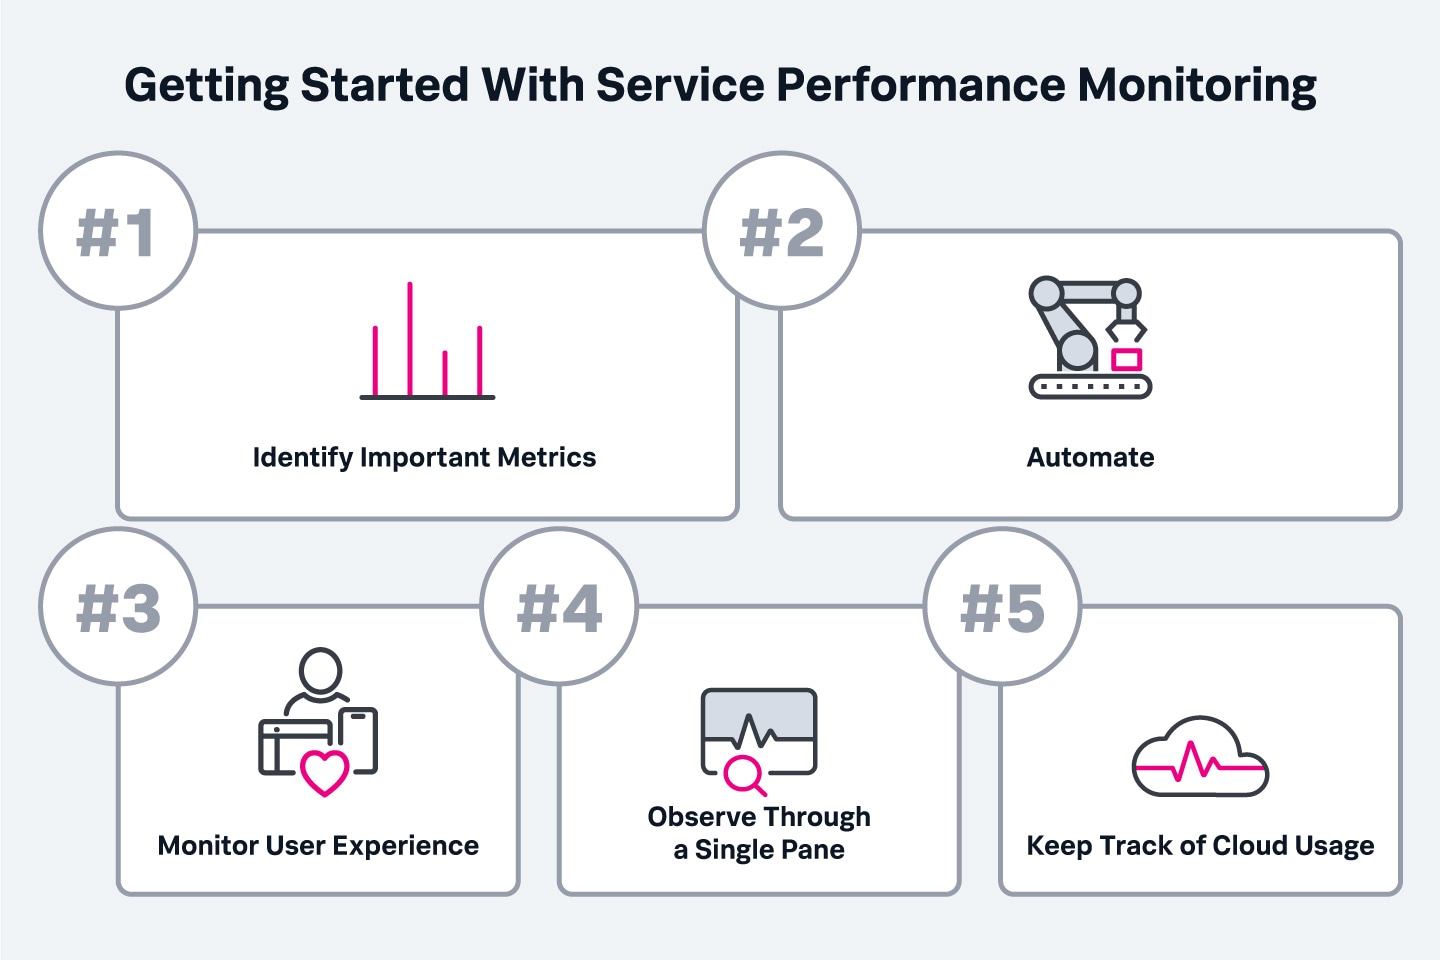
To maximize the value of service performance monitoring, organizations should:
In the past, service performance monitoring has been a core skill of QA engineering teams and IT Service Management functions within the organizations. Recent advancements of LLMs has created an additional layer of intelligence embedded into the service performance monitoring pipeline. LLMs work as an interface for Devs and Ops to act on the data and insights generated from service performance monitoring tools.
LLMs can help to:
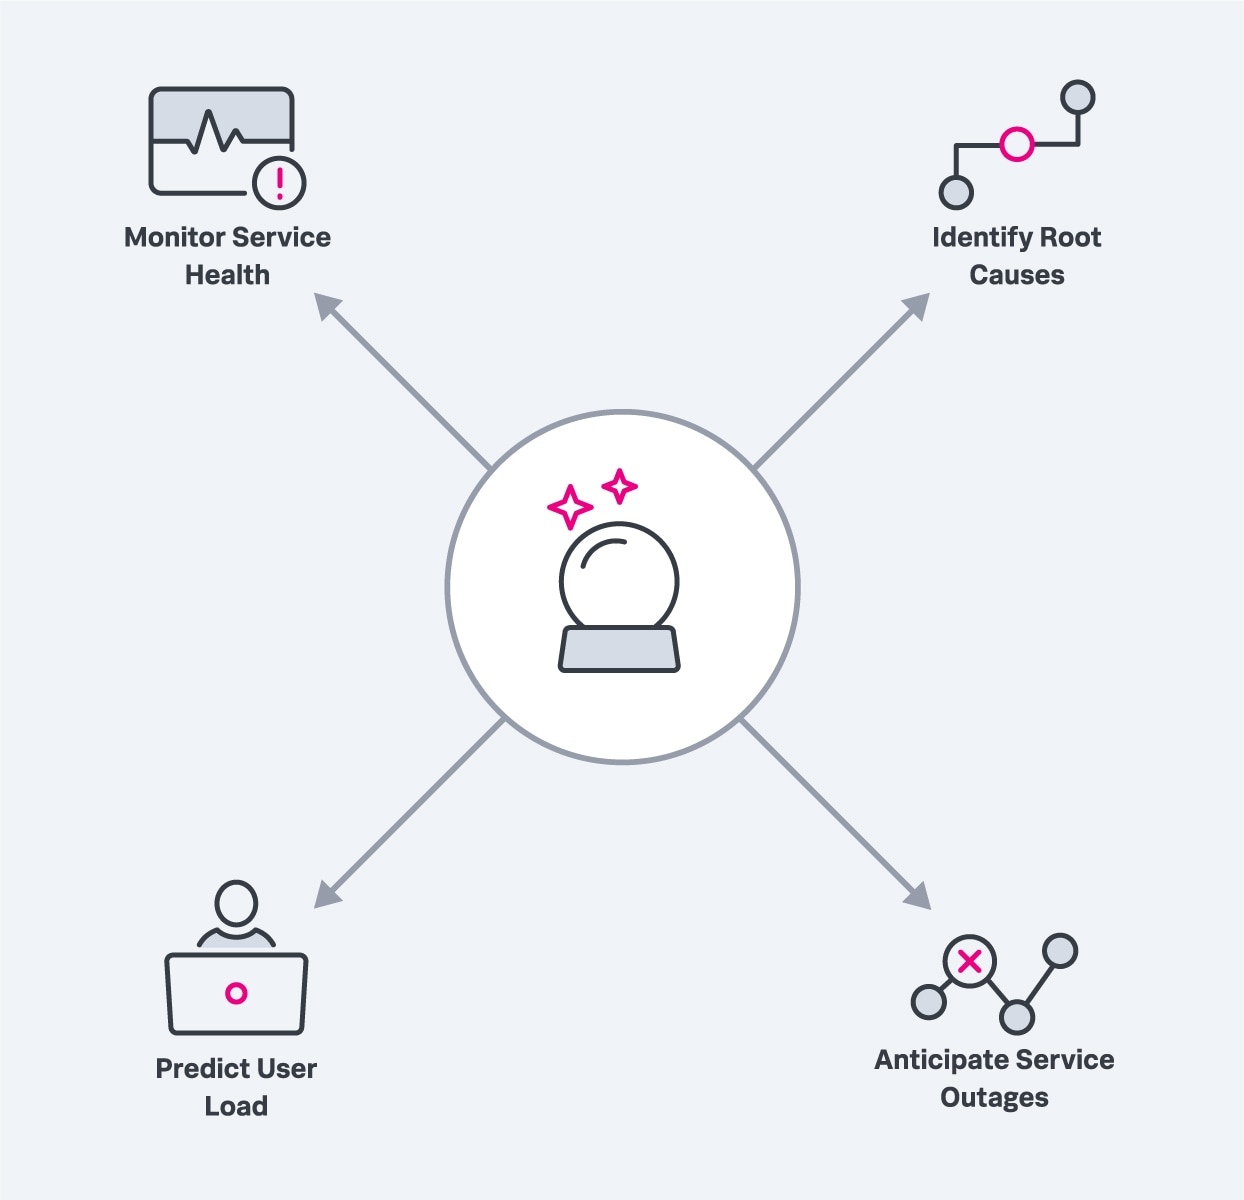
Predictive analytics enables modern performance monitoring solutions and improves cloud service performance in many ways.
With this information, DevOps teams can understand how their builds and CI/CD changes affect the performance of the end-products and user experience.
IT service performance monitoring is essential for ensuring optimal operation, reliability, and business value from IT systems. By leveraging modern tools, metrics, and emerging AI-powered capabilities, organizations can proactively manage their environments, meet SLA obligations, and continuously improve user experience and business outcomes.
See an error or have a suggestion? Please let us know by emailing splunkblogs@cisco.com.
This posting does not necessarily represent Splunk's position, strategies or opinion.

The world’s leading organizations rely on Splunk, a Cisco company, to continuously strengthen digital resilience with our unified security and observability platform, powered by industry-leading AI.
Our customers trust Splunk’s award-winning security and observability solutions to secure and improve the reliability of their complex digital environments, at any scale.

Get the latest articles from Splunk straight to your inbox.
© 2005 - 2025 Splunk LLC All rights reserved.