Observability
Splunk Infrastructure Monitoring
Whether on-prem, hybrid or multicloud, Splunk delivers real-time monitoring and troubleshooting to help you visualize and analyze performance in seconds and with greater accuracy.
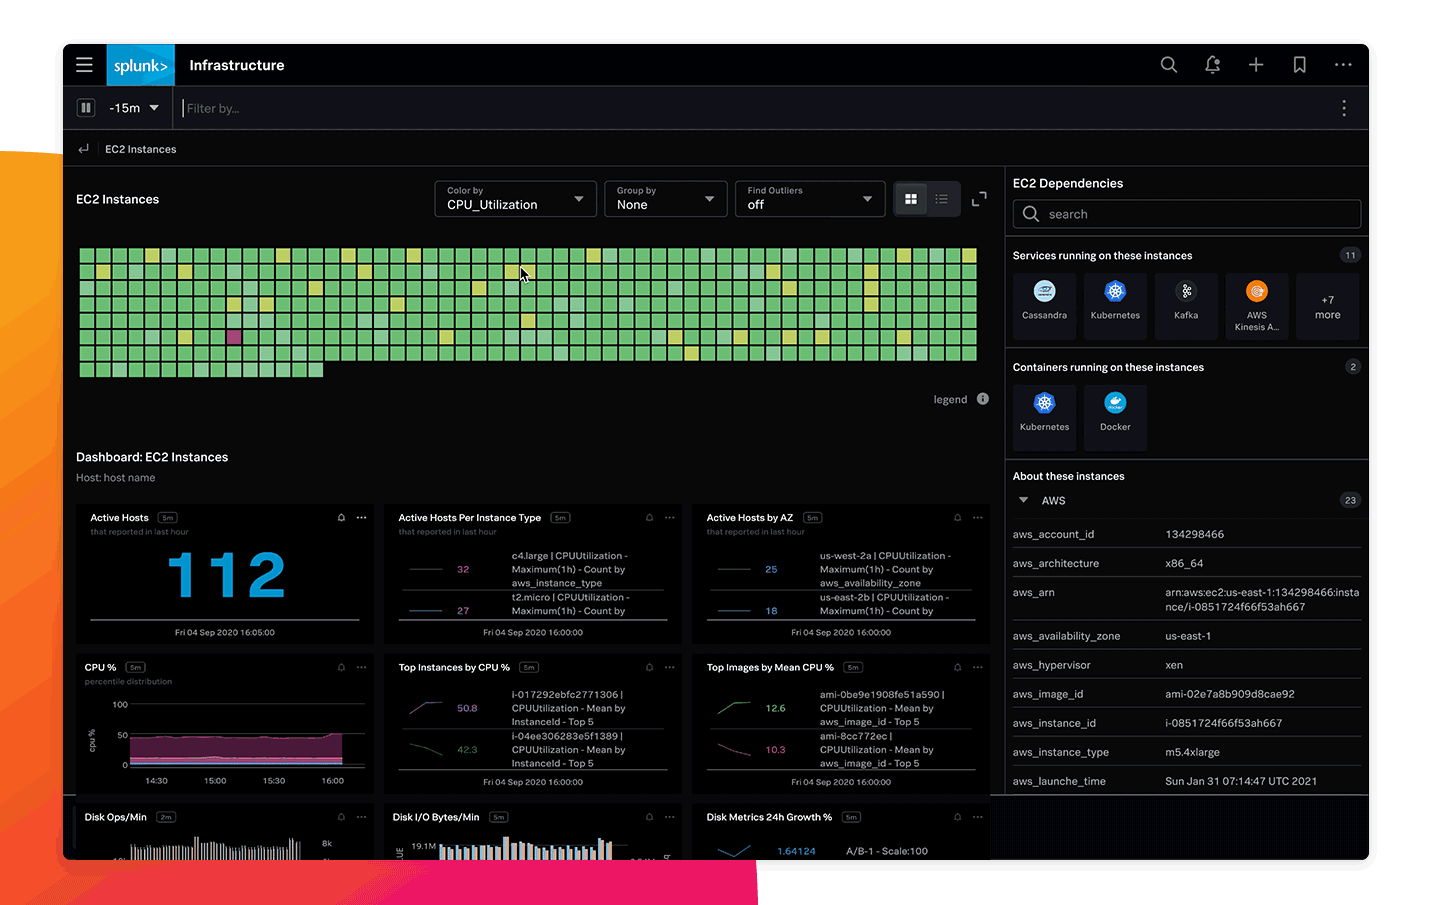
Instantly visualize your entire environment
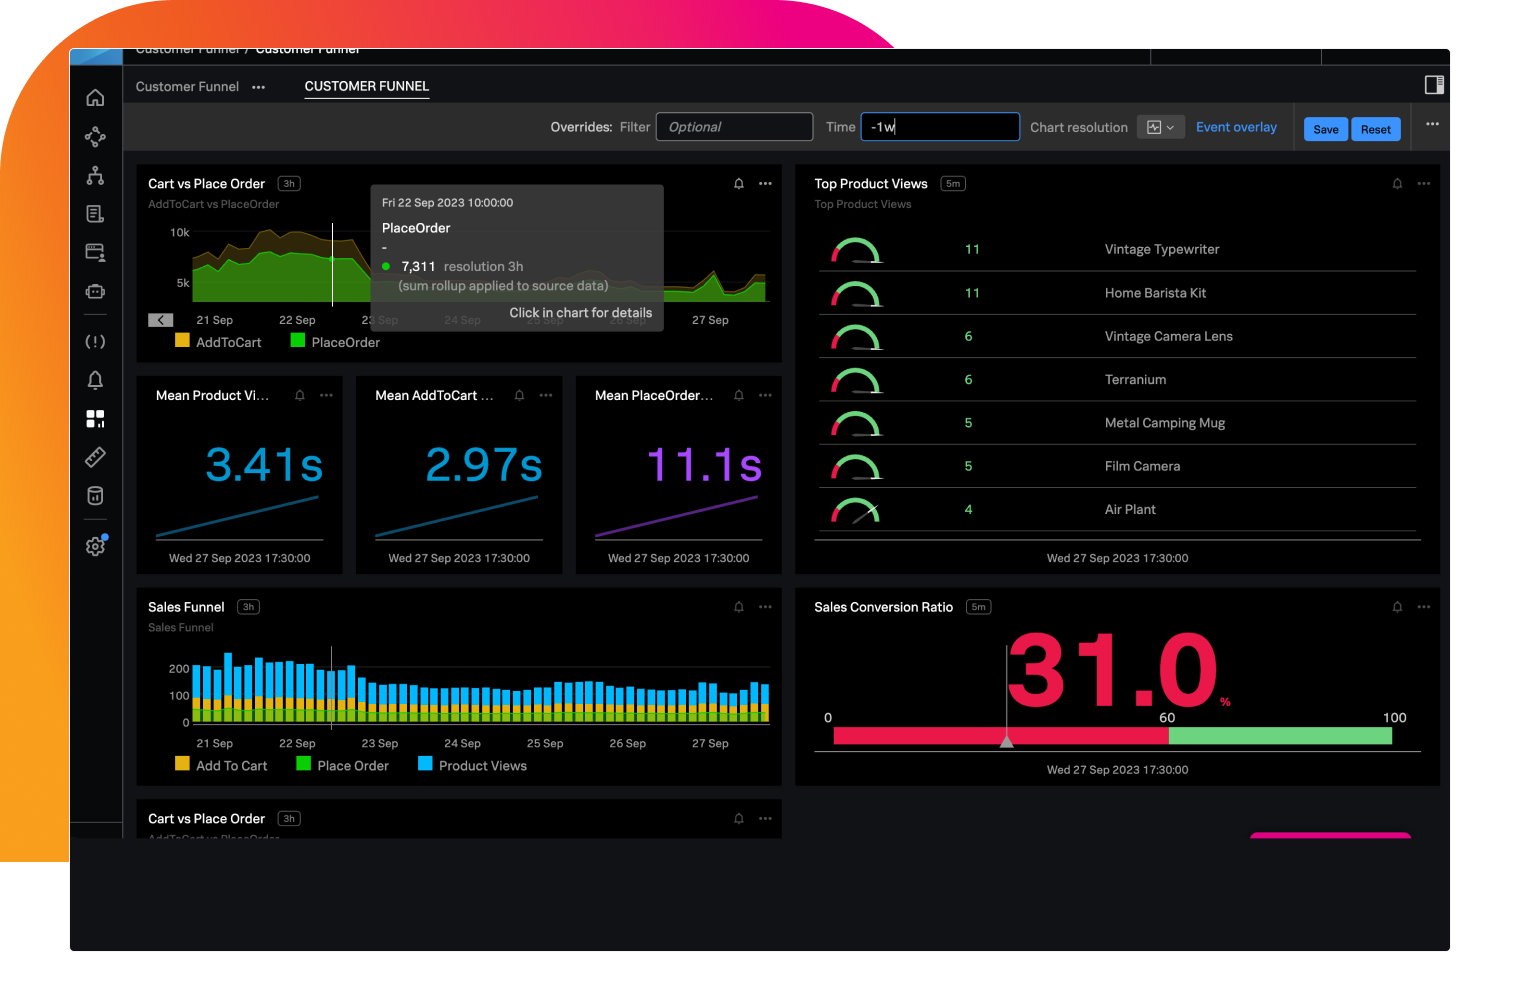
Get fast time to value with 300+ cloud service integrations and pre-built dashboards out of the box for rapid, full-stack visualization. Autodiscover, break down, group and explore clouds, services and systems in minutes.
Troubleshoot in real time
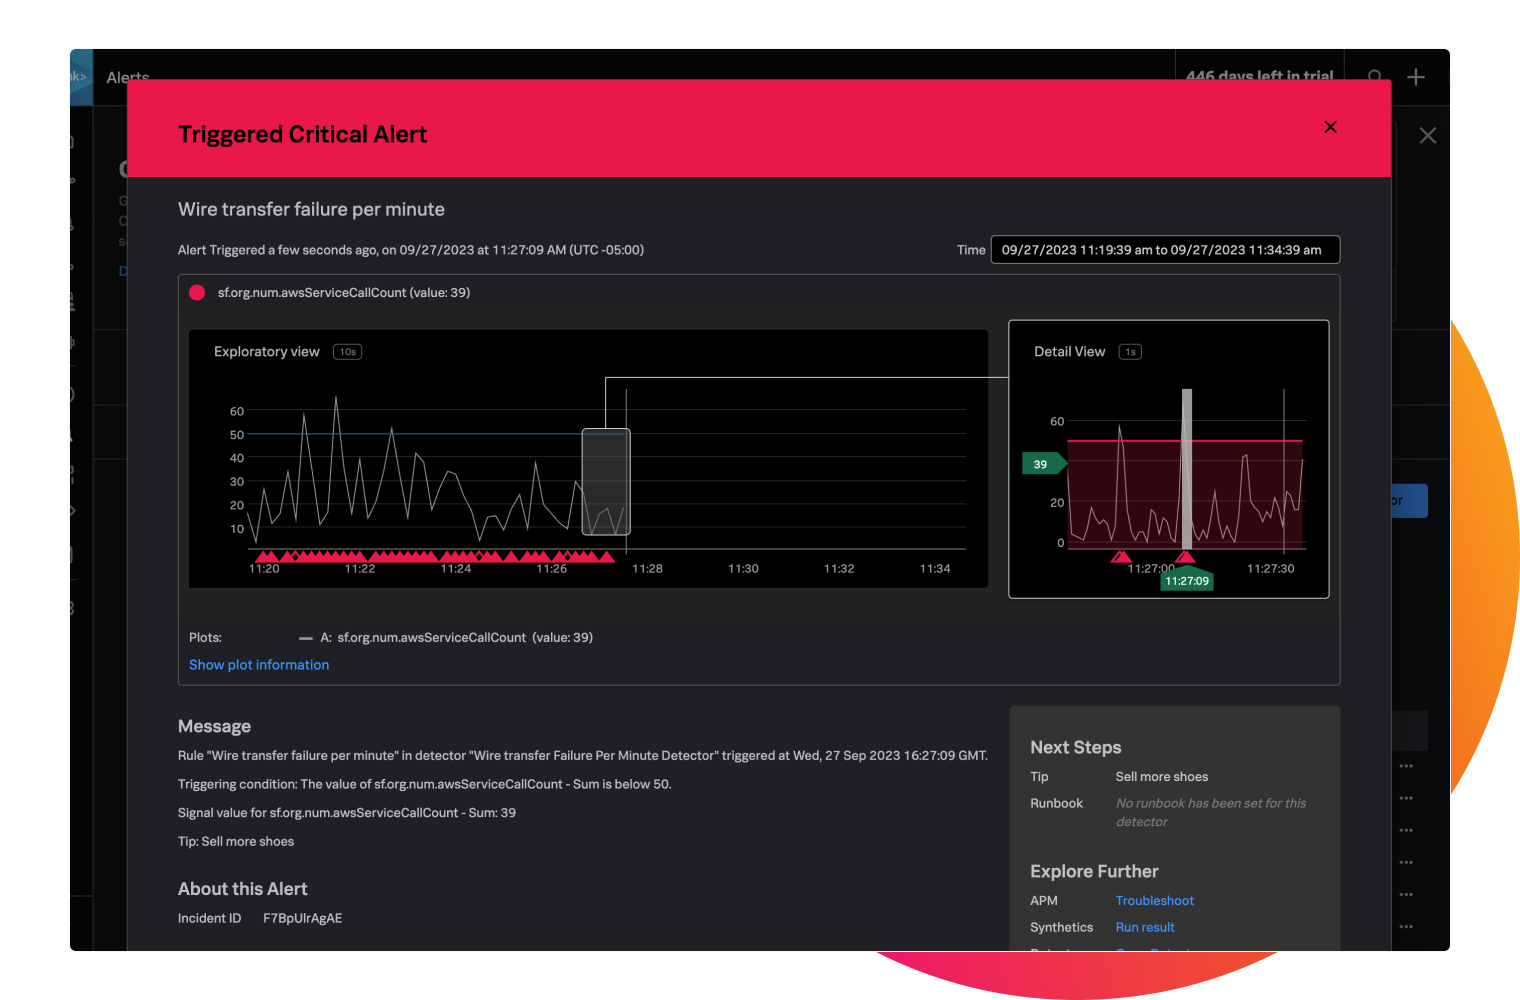
Act before infrastructure performance affects end-user experience. Instantly detect and accurately alert on dynamic thresholds, multiple conditions and complex rules to eliminate alert storms and dramatically reduce MTTD/MTTR.
Seamlessly align to business priorities
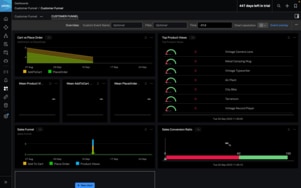
Answer business-critical questions in context and monitor service-level objectives and indicators instantly. Track custom metrics for business KPIs.
Scale your business — not your bill
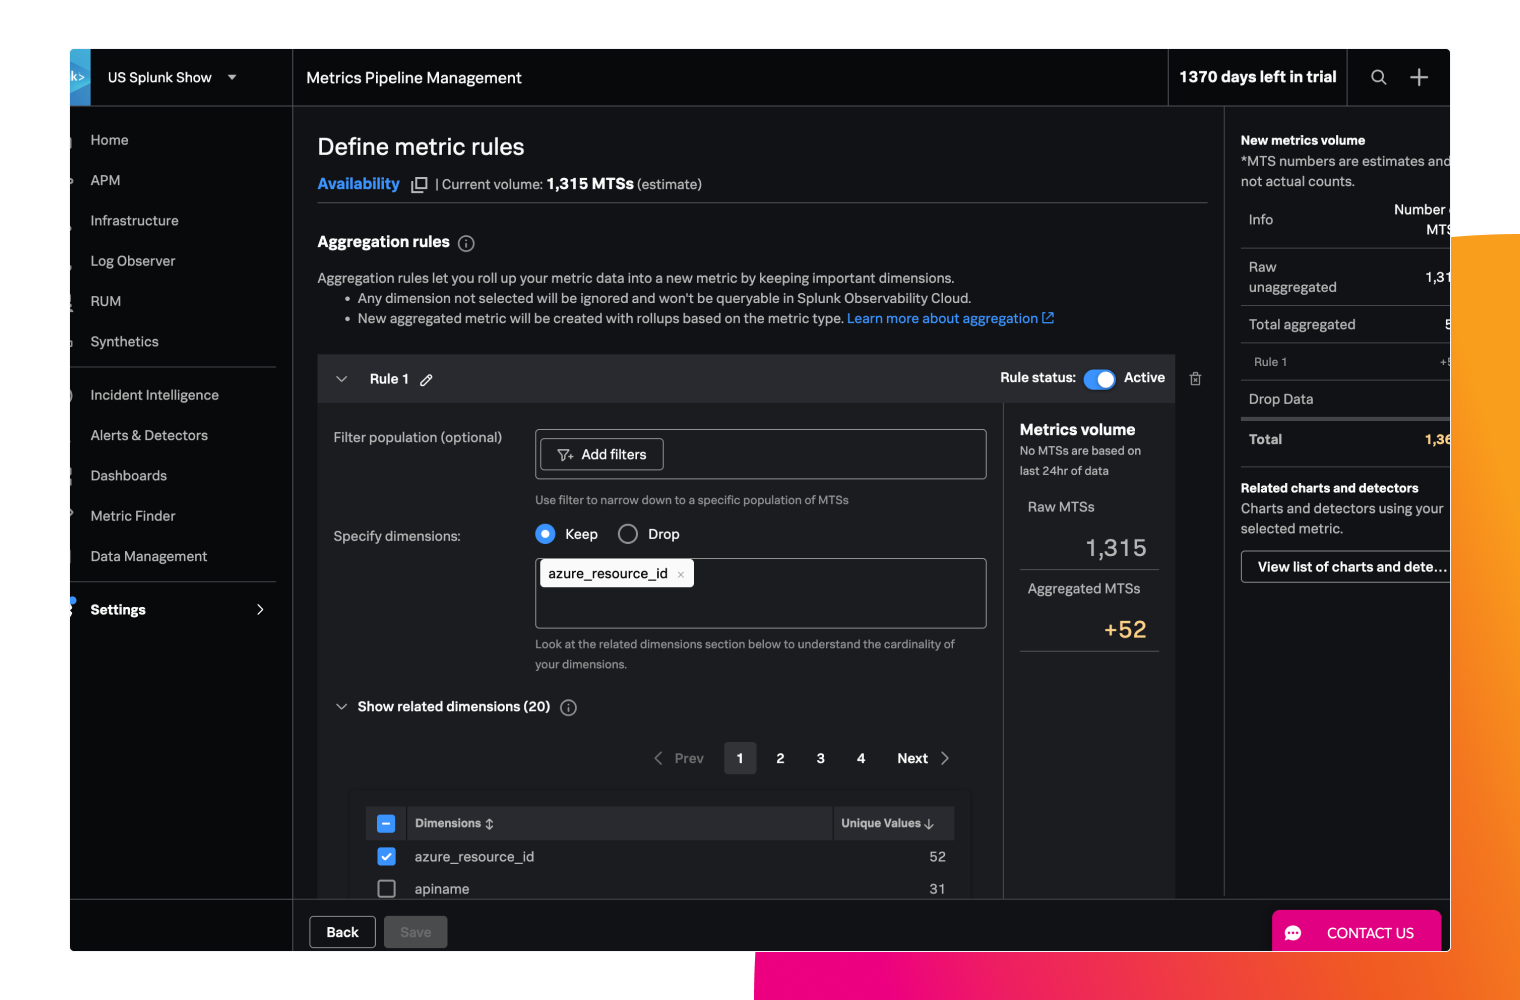
Troubleshoot across thousands of microservices and billions of events without missing anything. Aggregate metrics before they're ingested or drop any unused metric time series so that you can focus on scaling your apps — not your monitoring bill.
Features
Real-time monitoring and analytics at scale for any environment
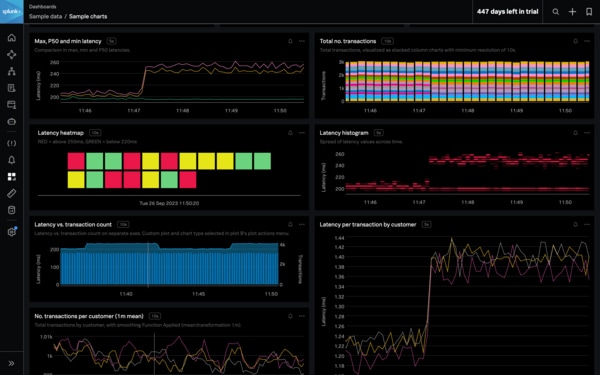
Streaming architecture and a custom metrics platform deliver near-instant visibility and faster troubleshooting for hybrid and multicloud.
Full-stack visibility
Seamless correlation between your hybrid infrastructure and microservices paints a clearer picture with in-context insights for directed troubleshooting with no context switching.
Real-time streaming analytics
When every second counts, only streaming architecture can ingest, analyze and alert in seconds. Blend metrics and logs for in-flight analytics from a single, integrated dashboard.
Centralized management
Shift-left monitoring with programmable APIs and monitor-as-code in CI/CD with transparency and enterprise controls for self-service deployment.
Logs in context
Combine real-time metrics with logs already ingested in Splunk Platform via Log Observer Connect for deeper insights of your cloud and faster root cause analysis — in one centralized tool.
Metrics pipeline management
Manage your metrics cardinality within the platform by aggregating (reducing dimensions) or filtering out the data you don’t need. Save engineering time spent building and maintaining proxy systems and pipelines and reduce your total cost of ownership.
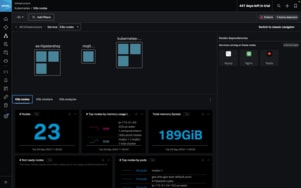
Advanced Kubernetes monitoring
Automatically discover and instantly visualize Kubernetes objects, their health and their performance with customizable dashboards and charts.

Are you a current Observability Cloud customer looking for learning resources?
Check out our Observability Learning Path on Splunk Community, with curated content organized by skill level.

CUSTOMER STORY
Bosch Rexroth AG Gains IT and OT Observability and Reduces Energy Costs by 20-30%
With Splunk’s real-time dashboards, we can make decisions faster and ensure production runs as smoothly as possible.
20-30%
reduction in energy costs (EUR)
25-30%
reduction in greenhouse gas emissions (CO2e kg)


Application Performance Monitoring
Solve problems faster in monoliths and microservices by immediately detecting problems from new changes, confidently troubleshooting the source of an issue and optimizing service performance.
Logs in Observability
Log analysis across your cloud-native application and cloud environments.
Real User Monitoring
The only full-fidelity, end-to-end visibility solution for end-user experience.
Synthetic Monitoring
Go beyond basic uptime and performance monitoring for better digital experiences.
Splunk AppDynamics
Observe and secure your hybrid and on-prem applications across every environment.
Business and IT Service Monitoring
Protect service-level agreements and monitor service health with intelligent event management and ITSM integrations.