Tag: Splunk Apm
Latest Articles
displayMode
paginated
filter
tags
tags
Splunk Apm
showImagesOnMobile
false
limit
9
Observability
7 Minute Read
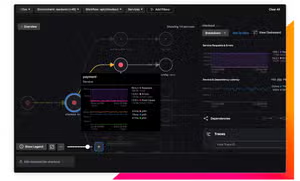
Harnessing the Power of Splunk APM Business Workflows in IT Service Intelligence
The latest release of the Splunk ITSI Content Pack for Splunk Observability Cloud now enables the automatic creation of ITSI services using service topologies from Splunk APM Business Workflows.

Observability
11 Minute Read
Don’t Live in the Past - APM 3.0 and Why You Need It
Application Performance Monitoring (APM) as a discipline and as a collection of supporting technologies has evolved rapidly since a distinct recognisable market for APM products first emerged in the 2007 - 2008 time frame. While there are many who would argue that APM has mutated into or been replaced by Observability, it makes more sense to see APM as one of many possible use cases now able to exploit the functionalities that Observability brings to the table - particularly when combined with AI.
Observability
2 Minute Read
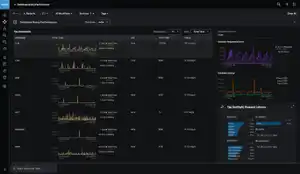
New APM Capabilities Help Optimize Application Performance Across Monoliths or Microservices
New Splunk APM releases help you quickly identify the biggest problems impacting customer experience and service performance across your applications.
Observability
2 Minute Read
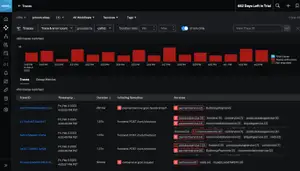
New Splunk APM Enhancements Help Troubleshoot Your MySQL and NoSQL Databases Faster
Splunk Observability is making it quicker and easier to troubleshoot latency in MySQL and NoSQL databases, with two new enhancements.
Observability
3 Minute Read
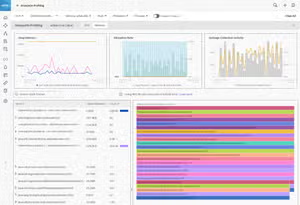
Splunk APM Expands Code Profiling Capabilities with Several New GAs
We’re excited to share new Splunk capabilities to help measure how code performance impacts your services – Splunk APM’s AlwaysOn Profiling now supports .NET and Node.js applications for CPU profiling and Java applications for memory profiling.
Observability
3 Minute Read
Announcing the General Availability of Synthetic Monitoring Within Splunk Observability
Splunk now offers fully integrated synthetic monitoring within Observability, helping IT and engineering teams proactively detect and resolve performance problems before they reach customers, with full visibility from the end user experience, through backend service performance

Observability
3 Minute Read
Splunk Remains the Leader in APM and Observability — GigaOm Report Confirms It
We're extremely proud that in its inaugural report, GigaOm Radar for Application Performance Monitoring (APM) Report, 2021*, Splunk was named a Leader and one of only two Fast Movers.

Observability
2 Minute Read
Splunk RUM Frontend Error Monitoring is Now Generally Available!
Splunk RUM Frontend Error Monitoring Helps engineering teams quickly scope, prioritize, and isolate their most impactful customer-facing JavaScript errors.

Observability
3 Minute Read
Announcing the GA of Splunk APM’s AlwaysOn Profiling
Splunk APM now includes AlwaysOn Profiling for Java applications, providing app developers and service owners continuous visibility of code level performance to troubleshoot production issues faster.
/en_us/blog/fragments/subscribe-footer