Tag: Splunk Apm
Latest Articles
displayMode
paginated
filter
tags
tags
Splunk Apm
showImagesOnMobile
false
limit
9
Observability
3 Minute Read
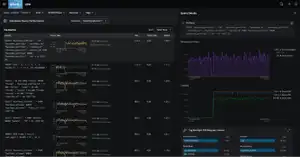
New: Optimize Slow Queries with Enhanced Database Visibility in Splunk Observability
Splunk APM’s enhanced database visibility now helps you find slow and high execution queries causing service performance issues in SQL databases, no instrumentation required. On-call Service owners and SREs can quickly identify if a database is causing performance issues, isolate the query responsible, and pinpoint root cause within distributed systems, to troubleshoot faster.
.conf & .conf Go
3 Minute Read
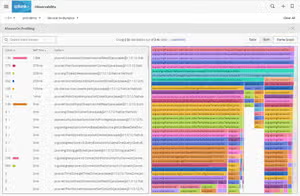
Announcing the Preview of Splunk APM’s AlwaysOn Profiling
Splunk APM now includes AlwaysOn Profiling for Java applications, providing app developers and service owners visibility of code level performance to troubleshoot production issues faster.

.conf & .conf Go
5 Minute Read
Innovate Faster and Deliver Better User Experiences with New Enterprise Observability Capabilities
Splunk is announcing new enhancements to the Splunk observability portfolio to significantly accelerate customers’ performance, productivity and innovation, all the while propelling their data-driven transformations forward.

Observability
4 Minute Read
How to Instrument a Java App Running in Amazon EKS
Amazon EKS and Kubernetes has become top of mind for many SREs. Learn how to instrument a basic Java application running on Amazon EKS with Splunk APM.

Observability
6 Minute Read
Real User Monitoring: Past, Present and Future
In this post, we trace the history of real user monitoring (RUM) tools and argue that we're again on the precipice of change, where legacy RUM tools are no longer good enough for new users and their needs.

Observability
4 Minute Read
Debugging Microservices with Distributed Tracing and Real-Time Log Analytics
Learn more about how Splunk APM and Splunk Log Observer make debugging microservices with distributed tracing and real-time log analytics fast and easy.

Observability
6 Minute Read
Distributed Tracing for Kafka Clients with OpenTelemetry and Splunk APM
In this blog, we will cover how to enable distributed tracing for Kafka clients with OpenTelemetry and Splunk APM.

Observability
4 Minute Read
Why You Need Real-Time for Faster MTTR
Time to respond and resolve issues are of major importance in today's complex systems, especially in microservices in clouds. Make sure your monitoring gives you the ability to respond both quickly and accurately.

Observability
5 Minute Read
Monitoring AWS EC2 with Splunk Observability
What should you monitor in AWS EC2 to make sure you are getting the right data perspective and insights from your clouds? Discover how to start monitoring EC2 instances with Splunk Infrastructure Monitoring today.
/en_us/blog/fragments/subscribe-footer