

Improve hybrid cloud performance with instant visibility and real-time alerts.
OVERVIEW
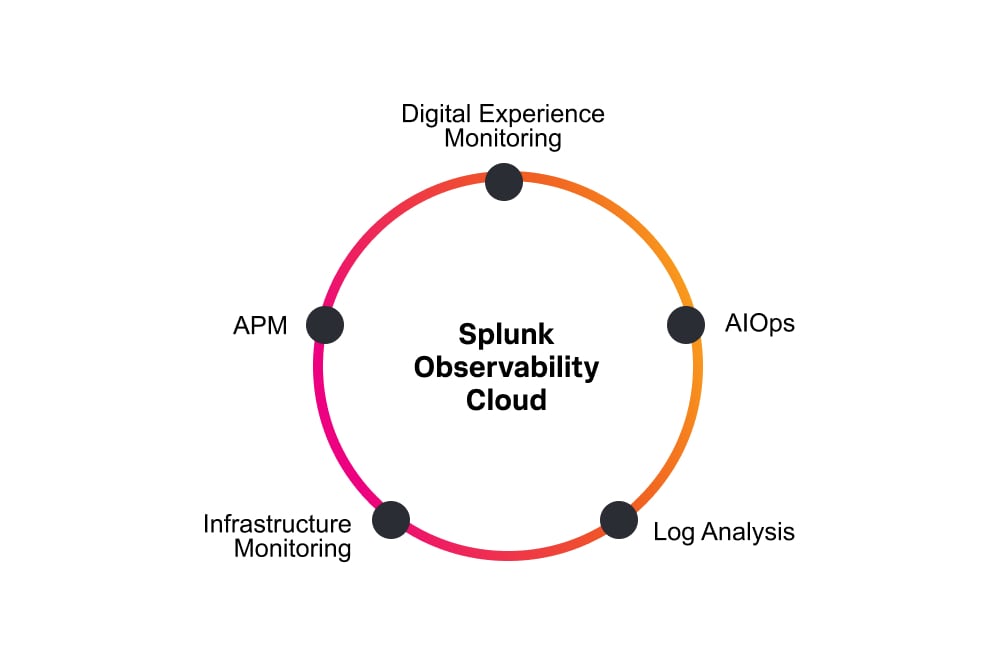
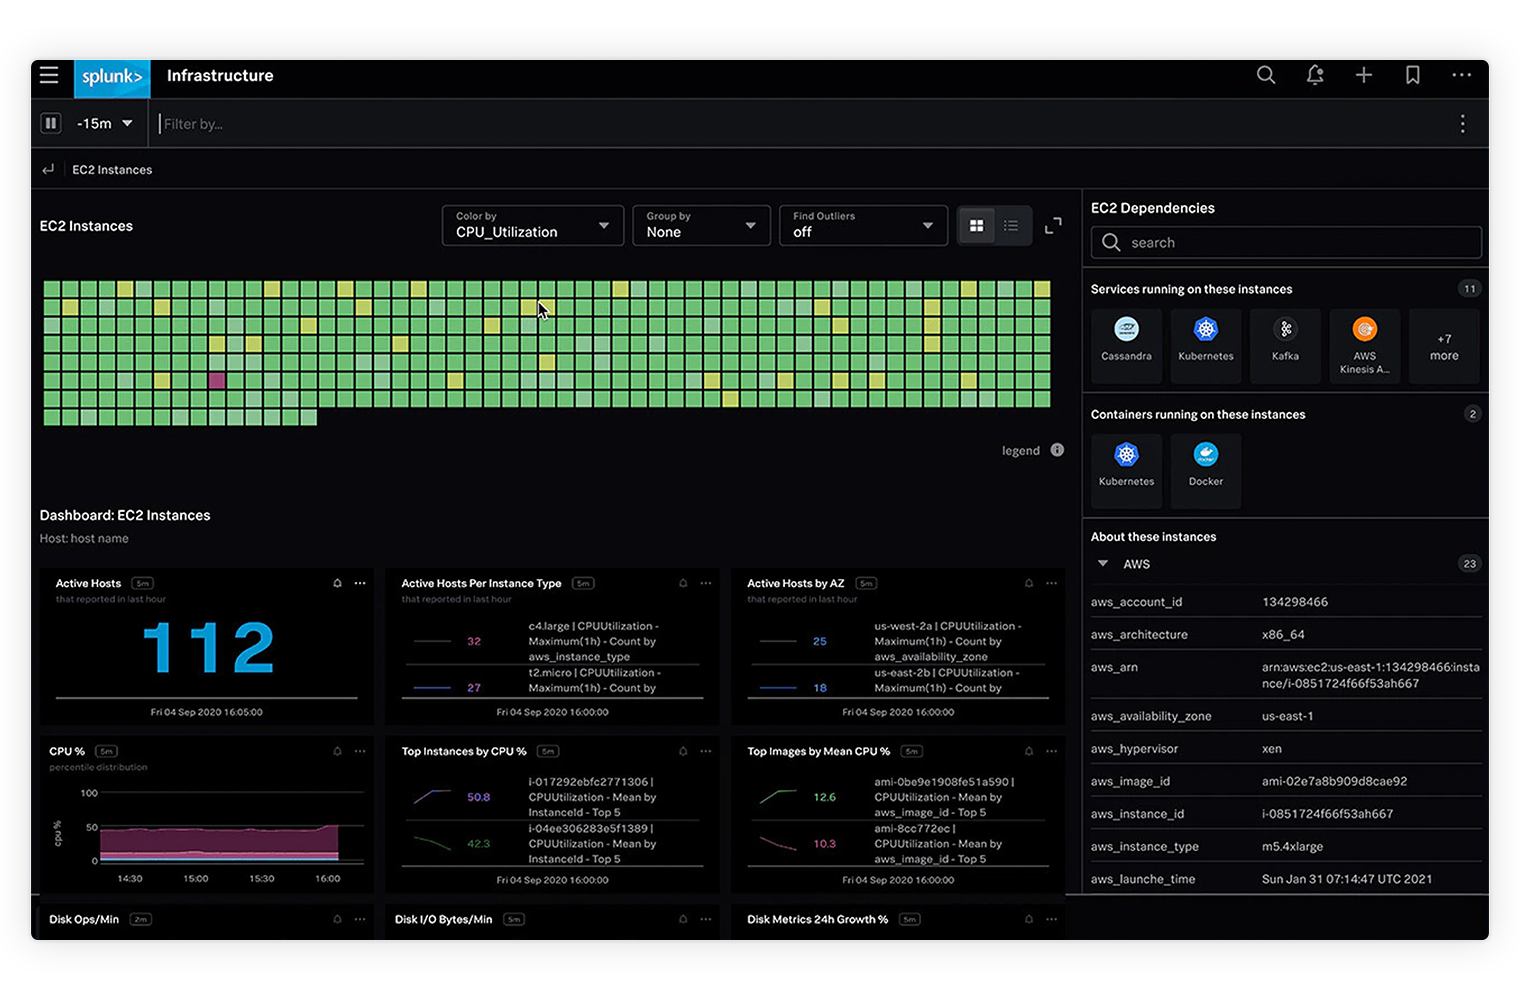
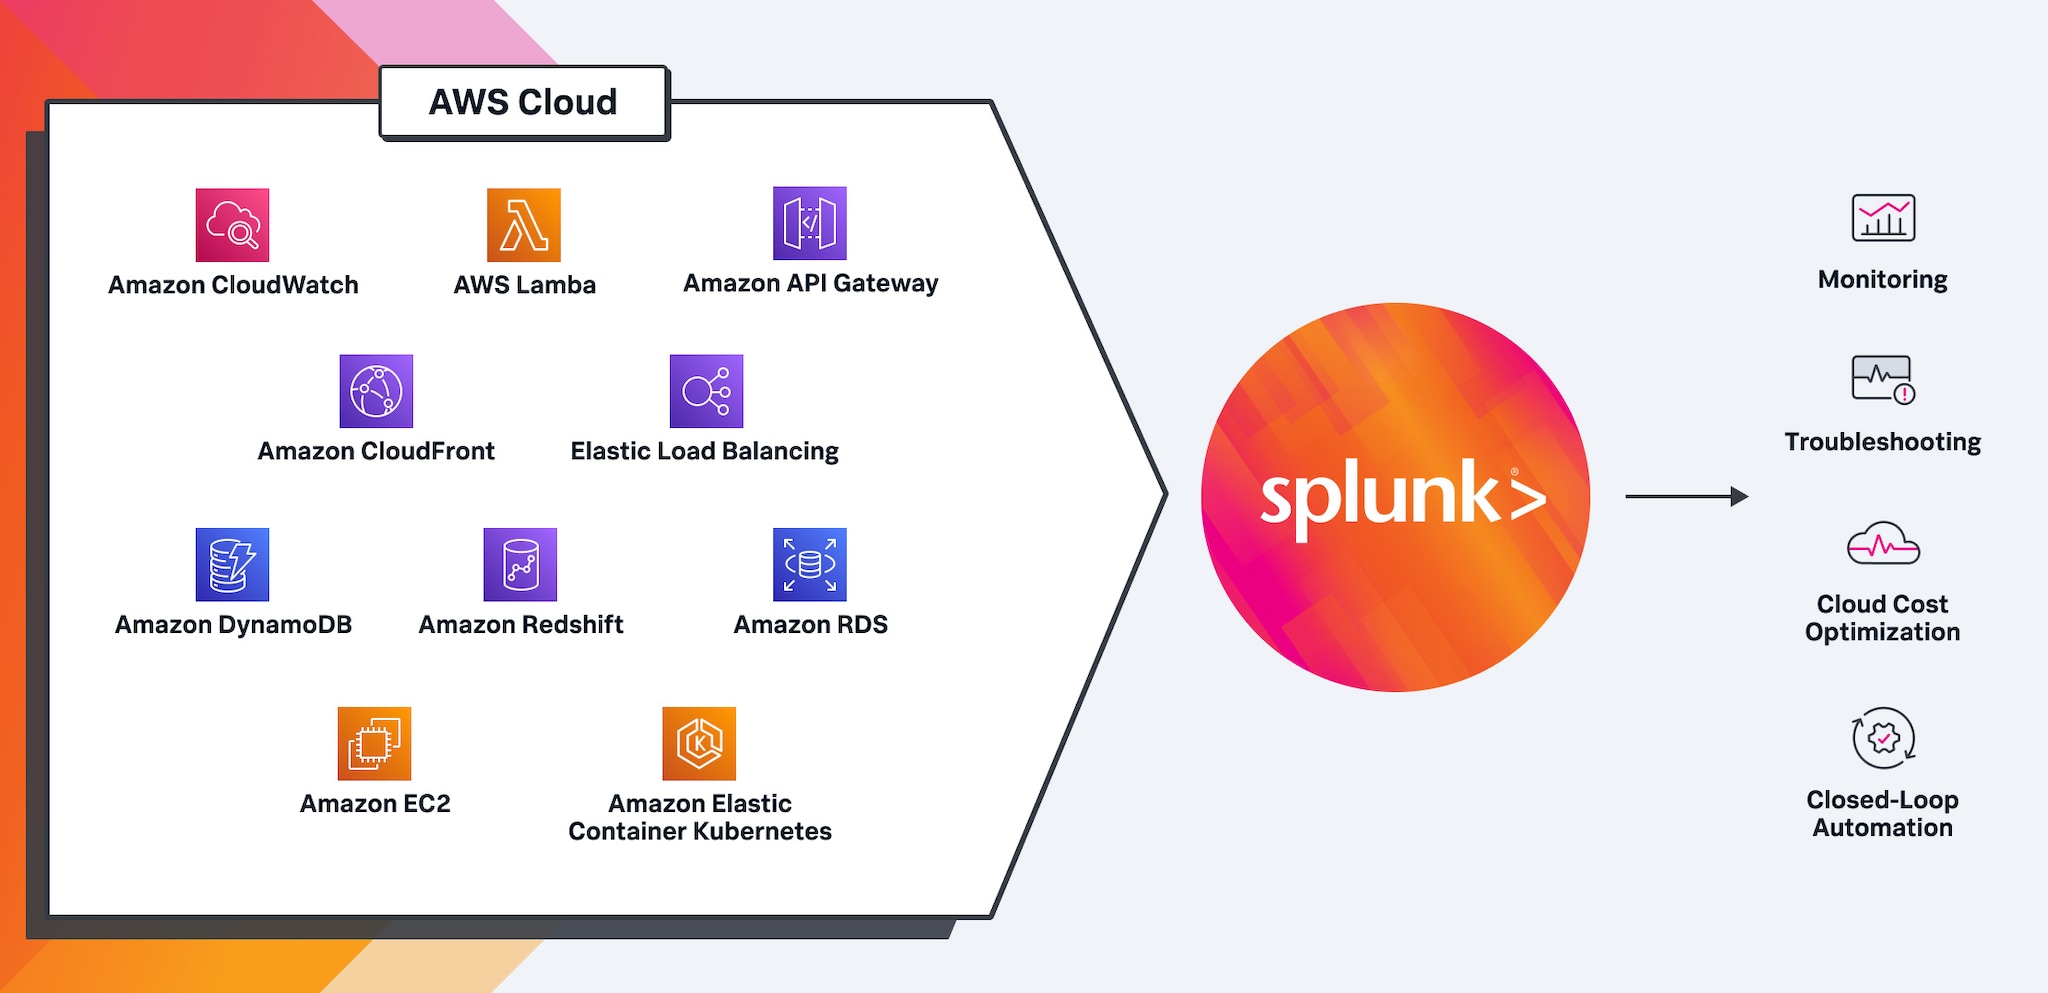
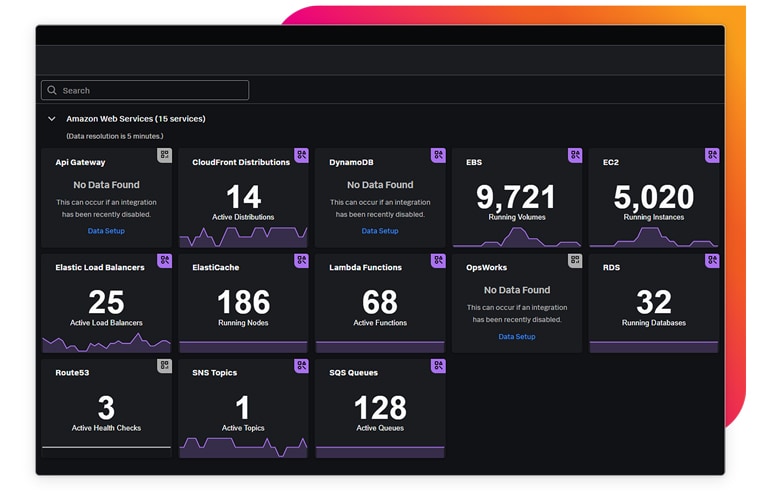
Full-stack, real-time, analytics-driven monitoring for AWS
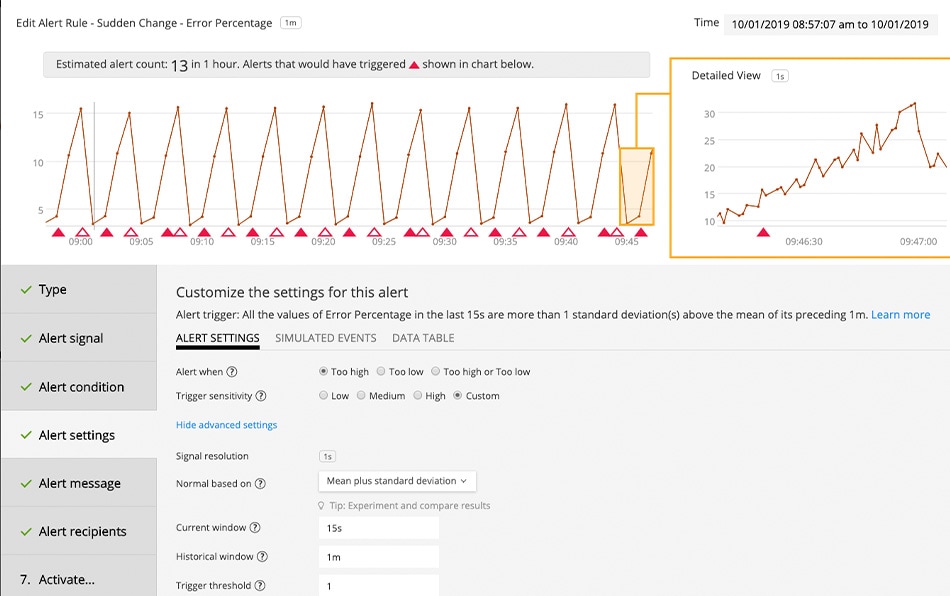
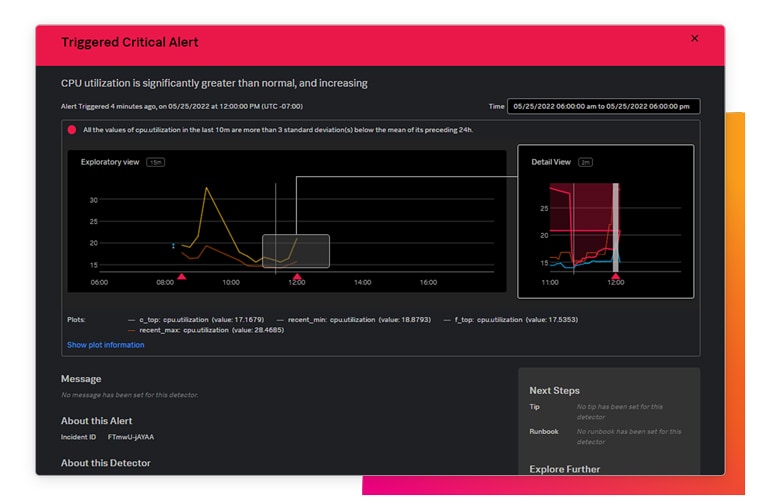
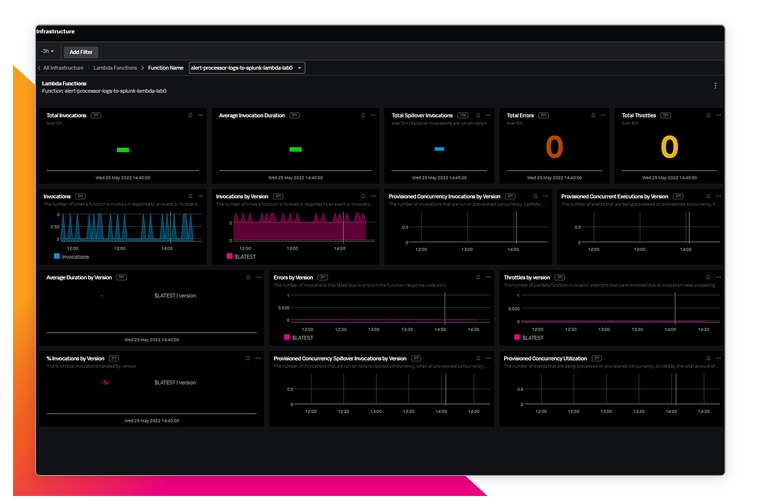
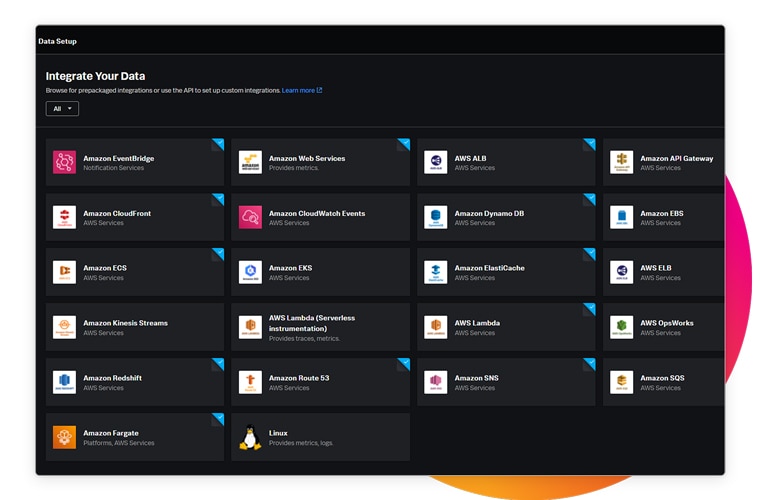
See all your insights in one place. Splunk Observability takes the complexity out of monitoring your AWS, hybrid cloud environment. Get complete, instant visibility with contextual insights across your infrastructure, applications and customer experience to anticipate problems before customers notice, and know where to look when a problem does occur.