Observability
Splunk Log Observer Connect
Leverage logs from Splunk Cloud or Splunk Enterprise in an observability platform designed for fast, codeless and in-context troubleshooting.
Find and fix issues fast with logs in context
Analyze logs with real-time metrics and traces. Get the full picture of your environment with Splunk Infrastructure Monitoring and Splunk APM so you can easily find the source of an anomaly.
Enjoy a platform that adapts to your needs
Get the best of both worlds: combine Splunk Cloud Platform’s logging scale and analytics with Splunk Observability Cloud’s point-and-click interface.
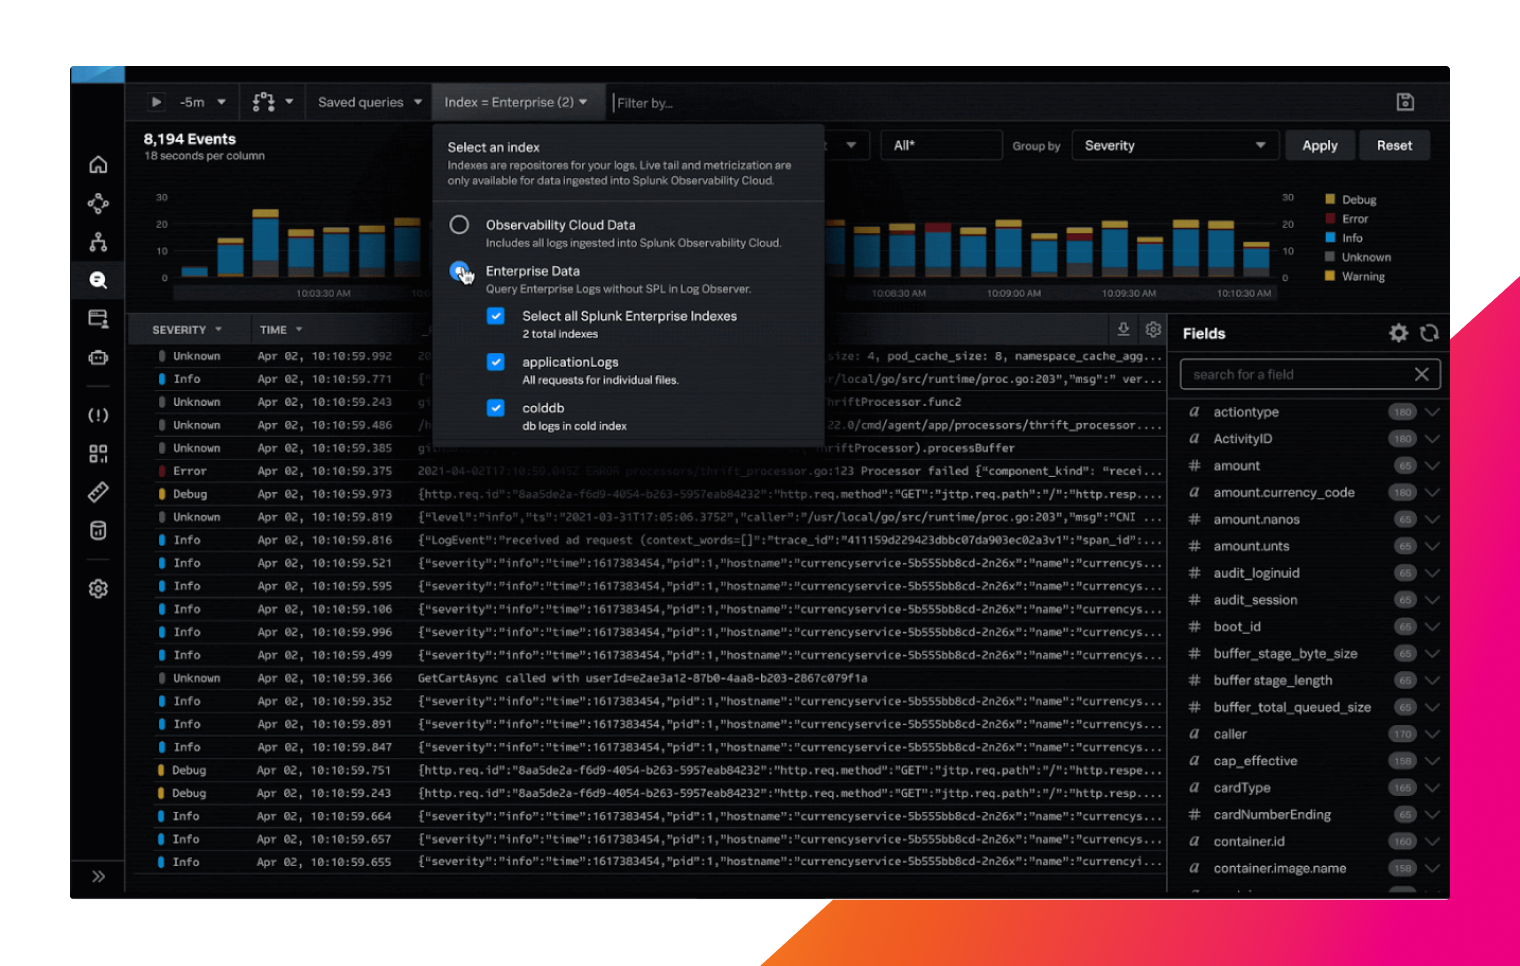
Centralize logs across teams and optimize costs
Say goodbye to tool sprawl. Splunk’s unified platform gives security, IT, and engineering teams access to one source of truth for logs, reducing data silos and operational maintenance.
The real problem we were facing was that we were unable to get all of our logs into a single place. We have an on-premise application with multiple servers across different data centers, and we needed to be able to view all of the logs together in order to troubleshoot any problems. That's why we started using Splunk to forward all of our logs to a single location.
Features
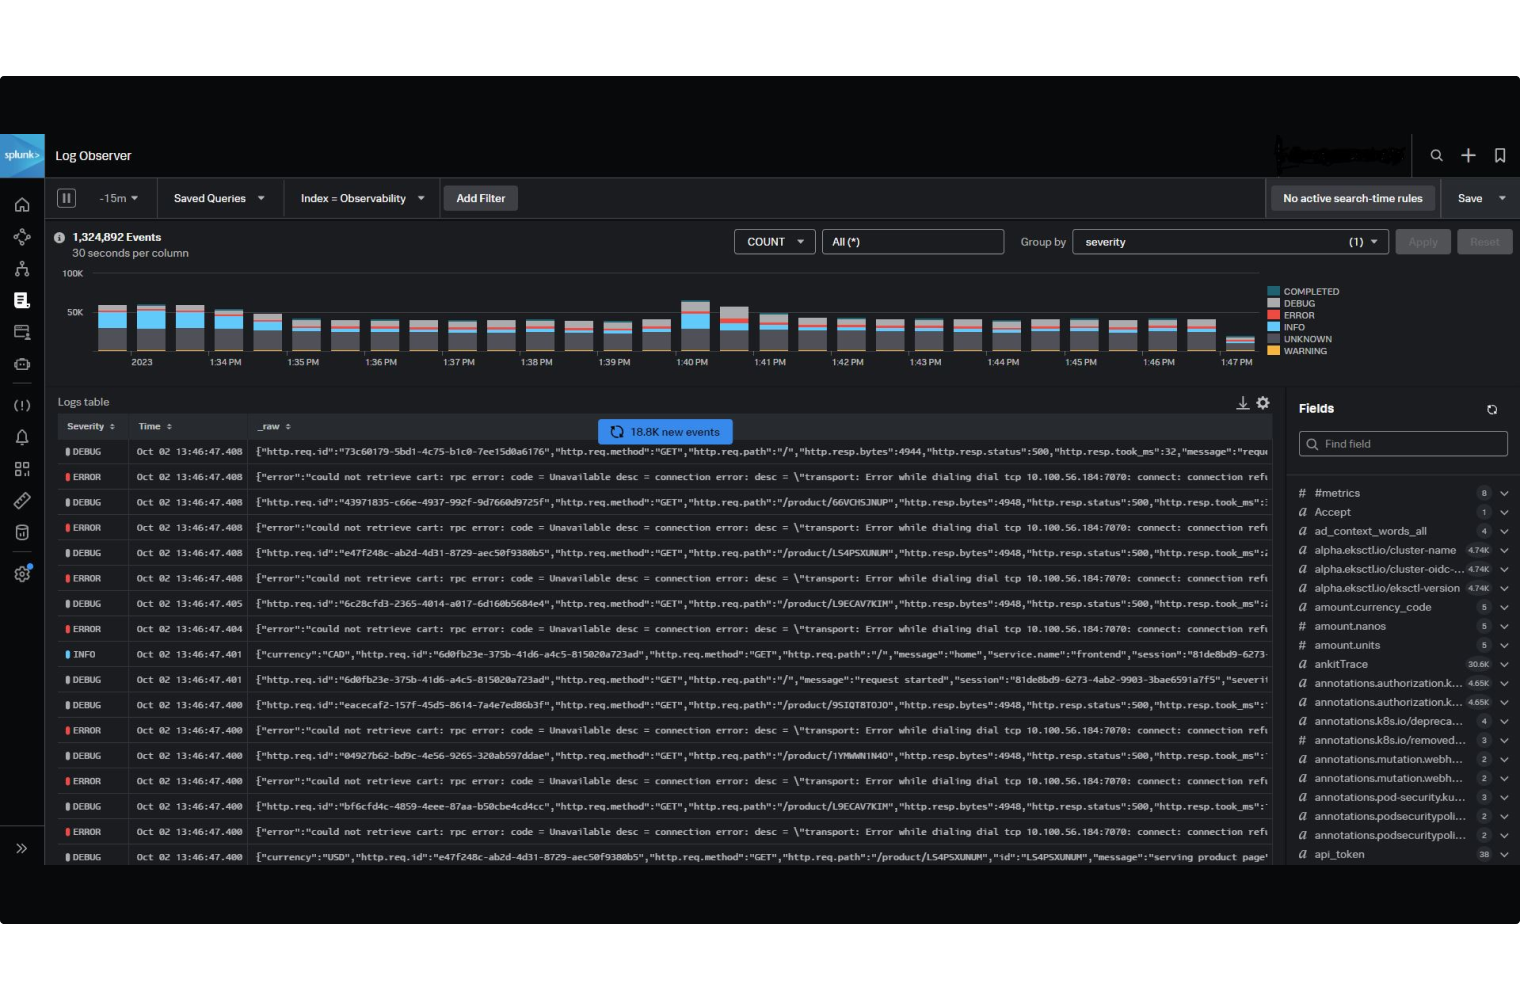
Search, filter and analyze log data at scale
Tap into industry-leading log management and analytics in Splunk Observability Cloud.
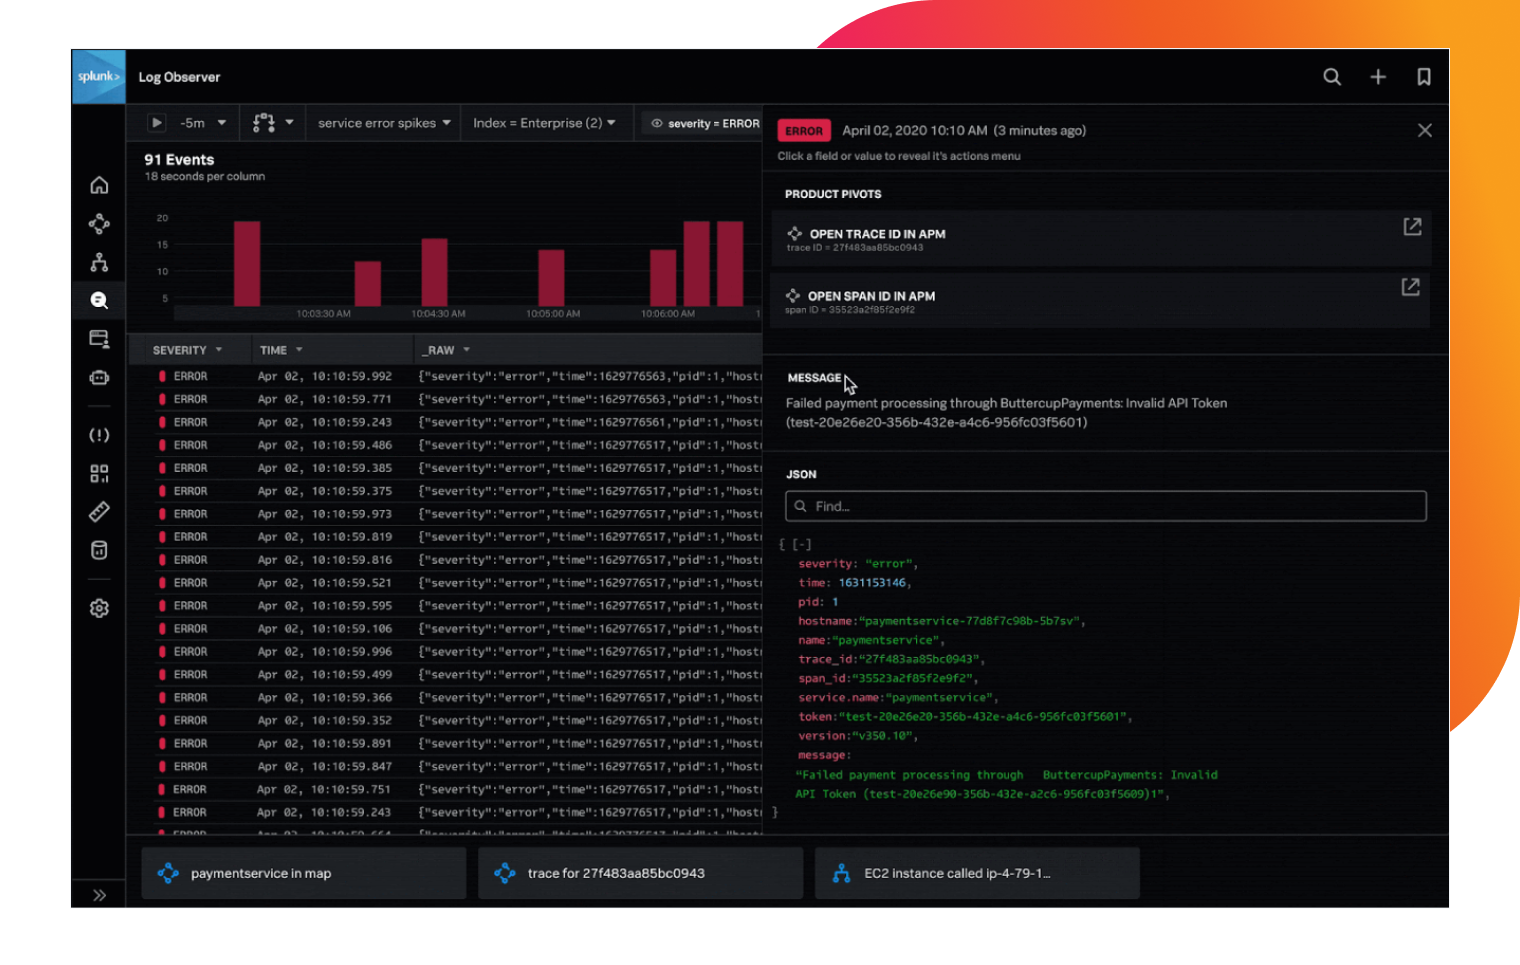
See data in context
Visualize the real-time metrics and traces for a specific log event in the same interface for more context.
No code, no problem
Perform queries or searches in a codeless and intuitive interface with pre-packaged dashboards and filters.
Report key insights in custom dashboards
Add log-based charts to customized dashboards for better metrics-based monitoring and faster root cause analysis.
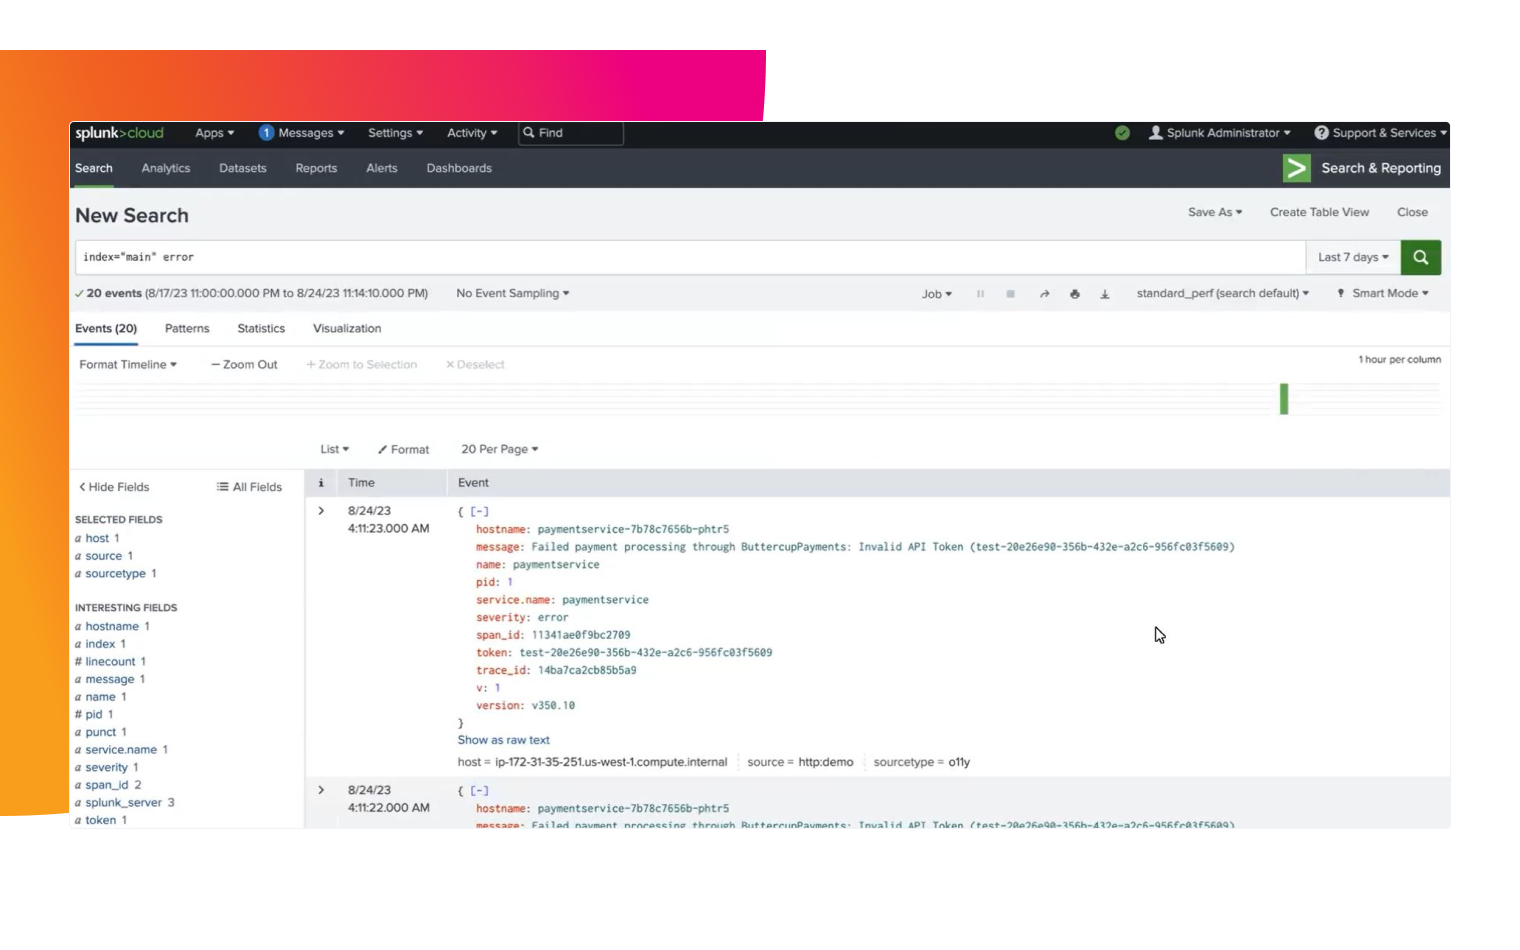
Open logs in Splunk Search
With one click, transfer the logs you see in Observability Cloud into Splunk’s Search and Reporting for your more advanced log analyses.
Optimize your storage
Store unused log data in 3rd party locations (IaaS or SaaS) to reduce indexed capacity and storage costs.

Are you a current Observability Cloud customer looking for learning resources?
Check out our Observability Learning Path on Splunk Community, with curated content organized by skill level.

CUSTOMER STORY
Rappi Fixes Issues 90% Faster During a 300% Surge in Orders
A single dashboard provides data for engineering, DevOps, site reliability engineering, SecOps, peer engineering and microservices, operations and business metrics. If something happens at Rappi, and we don’t see it on our Splunk dashboard, it’s actually not happening at all.
Splunk AppDynamics
Observe and secure your hybrid and on-prem applications across every environment.
Splunk Infrastructure Monitoring
The only real-time, analytics-driven multicloud monitoring solution for all environments.
Splunk Application Performance Monitoring
Full-fidelity tracing and always-on profiling to enhance app performance
Splunk Real User Monitoring
Add the only full-fidelity, end-to-end visibility solution for end-user experience.
Splunk Synthetic Monitoring
Go beyond basic uptime and performance monitoring for better digital experiences.