
5 DevOps Practices
Download this free guide to advance your DevOps journey.

Businesses today find themselves in a perpetual race against obsolescence. In fact, 91% are actively pursuing digital initiatives. However, the applications and software systems that once powered your innovation can quickly become anchors, holding you back from the latest solutions and user expectations.
That is where application modernization is vital to business long-term strategy. It’s not merely about updating software but reinventing how applications serve businesses and users in an age dominated by agility, cloud capabilities, and intelligent algorithms.
Moving from rigid legacy systems to embracing value-add trends, modernizing your applications is akin to setting your business on a direct path to innovation, growth, and sustained relevance. In this article, we’ll delve into the nuances of application modernization, its compelling benefits, and the promising trends shaping its future.
Application modernization transforms existing legacy software applications and systems to align with current technology standards and business needs. This transformation involves updating the application’s architecture, platform, infrastructure, or user experience to improve its performance, security, and agility.
If you were to buy an older home, you’d likely renovate it instead of tearing it down and rebuilding it from scratch. Likewise, it doesn’t make financial or operational sense for organizations to completely overhaul their current infrastructures whenever the newest technologies come onto the market. By modernizing, businesses can…
As technology continues to evolve at an alarming pace, application modernization offers critical business benefits.
When you invest in application modernization, you’re essentially fortifying your business against the lurking dangers of outdated software. Legacy systems, while they might have served you well in the past, accumulate what is known as technical debt over time. This debt isn’t just about the money spent on maintenance; it’s about the inefficiencies, bottlenecks, and limitations of older systems.
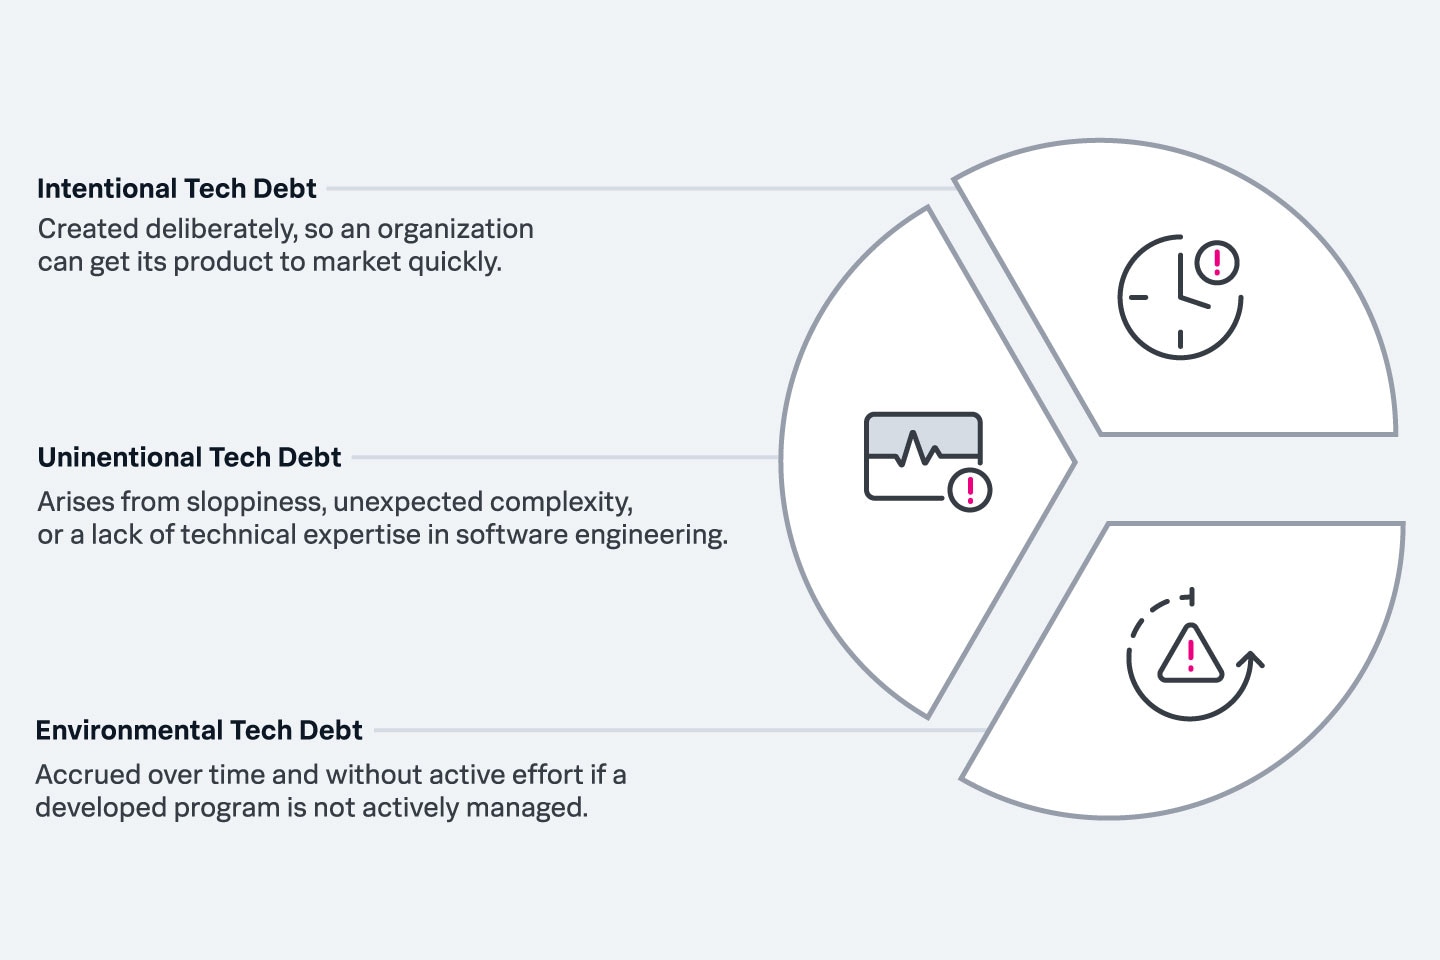
By modernizing, you’re paying off this debt, allowing your IT teams to work on innovative projects instead of constantly patching up old ones. This leads to improved teamwork and also boosts overall productivity.
Among the most significant risks of clinging to outdated software is its security vulnerabilities. Older systems often lack the defenses needed to combat contemporary cyber threats. Cyber attackers know that these systems are easier to target and won’t hesitate to exploit them.
By opting for modernization, you’re upgrading your defenses, plugging vulnerabilities, and ensuring compliance with the latest security standards.
User expectations are evolving at an unprecedented rate. Users expect seamless experiences, instant responses, and a degree of personalization that was once considered futuristic. In fact, 85% of senior executives believe that customers reset their digital expectations to match their best omnichannel interactions.
Application modernization is your ticket to meeting these modern demands head-on. By rejuvenating your legacy systems, you’re not just making technical changes but are recalibrating your entire digital experience to resonate with your contemporary user.
One standout benefit of modernizing your applications is increased agility. In software, agility signifies the ability to roll out new features, modify, and swiftly adapt to new technologies. With modern architectures like microservices or cloud-native platforms, businesses can modify specific application parts, allowing them to pivot quickly in response to user feedback or emerging trends.
Moreover, flexibility ensures business scale operations with ease, whether expanding to handle a surge in user traffic or integrating new technologies to enhance user experience. Whether incorporating a new payment gateway or embedding AI-driven functionalities, modernized applications can flexibly interweave various components, ensuring users get a cohesive and enriched experience.
Embarking on the application modernization journey is not just about addressing the present — you’re laying a robust foundation for the future. By updating your legacy systems and embracing modern architectures, you position your business to be proactive rather than reactive.
Modernized applications make scaling a more manageable endeavor. Business growth often strains IT infrastructure. However, with a modernized setup, you can scale resources up or down based on demand, ensuring optimal performance without overburdening your systems or incurring unnecessary costs.
As new technologies emerge, your modernized application framework allows for seamless integration. This adaptability means you’re always ready to harness the potential for the next big thing, keeping you a step ahead of the competition and ensuring your offerings resonate with your customer base's evolving needs and interests.
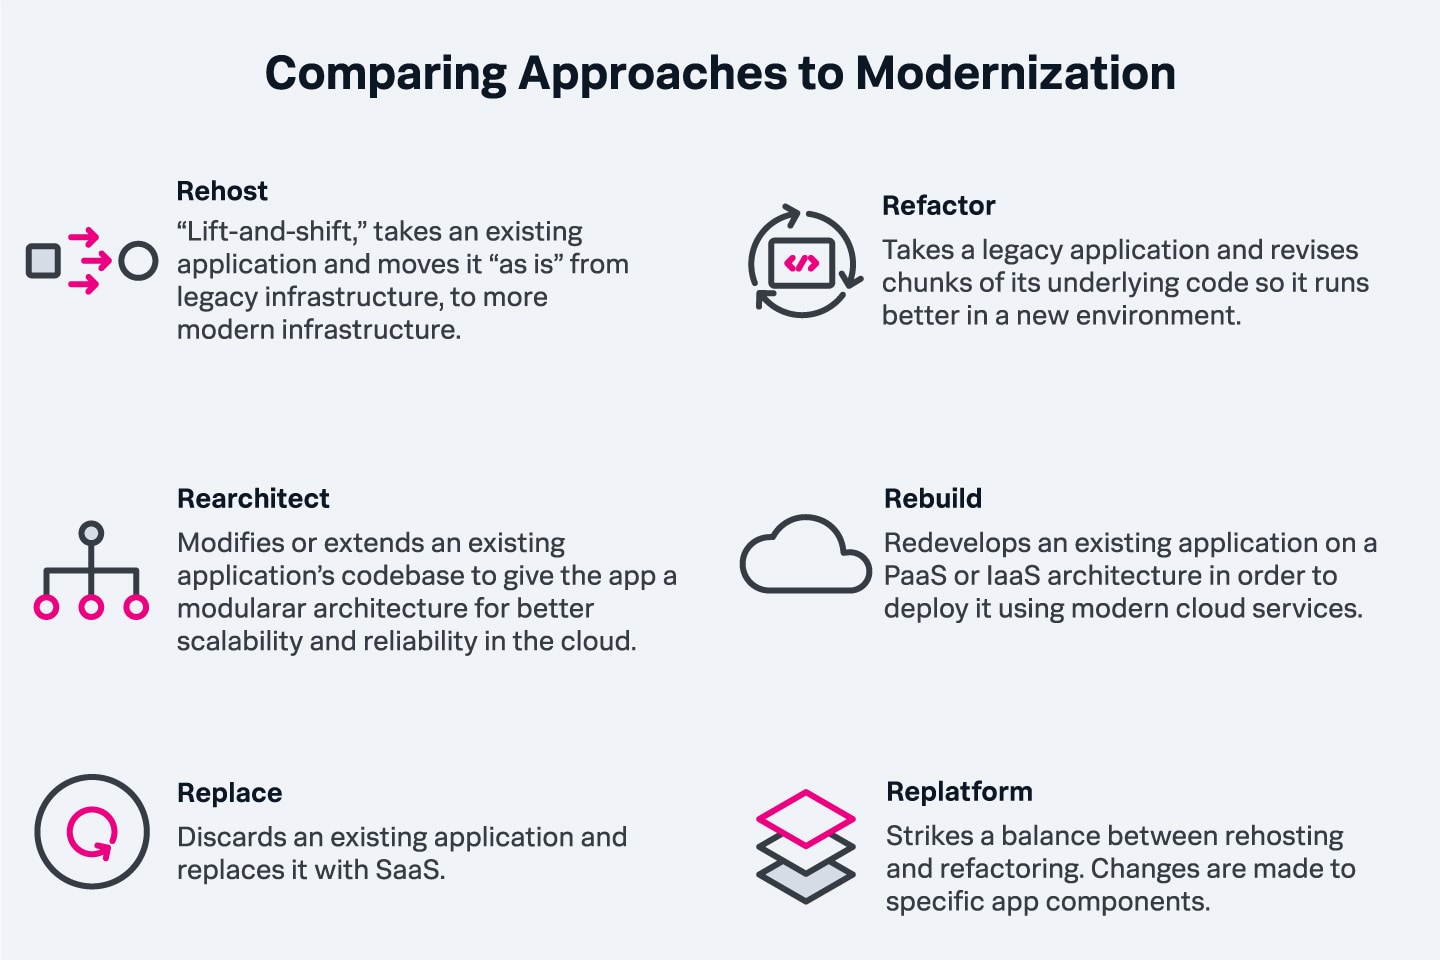
Let’s look at the most common forms of application modernization — that is, the actual work you can do to modernize apps.
Often called “lift and shift,” rehosting moves an application from on-premises infrastructure to the cloud without changing its code.
The primary goal of this type of application modernization is to leverage the benefits of a new environment, such as cloud scalability, without making changes to the infrastructure.
This type of application modernization restructures existing code to improve its non-functional attributes without altering its external behavior. It essentially optimizes the way the application works internally, often to make it more efficient, maintainable or cloud compatible.
Sometimes considered a compromise between rehosting and refactoring, replatforming is the process of migrating to a new runtime platform without making any significant changes to the architecture or code.
It aims to leverage the benefits of a new platform, like moving from a traditional database to a managed cloud database.
This form changes the application’s architecture to improve agility and scalability. This transformation enables applications to align better with business needs and technical requirements. It typically involves moving from a monolithic design to a microservices architecture, which enhances scalability and agility.

Rebuilding completely rewrites the application using modern languages and technologies. While it offers a fresh start, rebuilding requires discarding the existing codebase and starting from scratch, ensuring the new build meets contemporary and future demands.
When you dive into application modernization, it’s crucial to keep an eye on the horizon and be aware of the industry trends. Here are three pivotal trends you should be attuned to:
Containerization, with tools like Docker and orchestration platforms like Kubernetes, is changing the game. Containers encapsulate an application and its dependencies into a “container,” allowing it to run consistently across various computing environments.
For you, this means smoother deployments, improved scalability, and maintaining consistent environments from development to production. It’s akin to having a portable, standardized unit that encapsulates your application, ensuring it operates seamlessly, regardless of where it’s deployed.
(Do container security the right way.)
Gone are the days when you had to manage or provision servers. With serverless computing, you can focus purely on your code, and the cloud provider takes care of the rest. This event-driven model means resources are only used when a specific function or trigger is invoked. This translates to:
Artificial Intelligence (AI) and Machine Learning (ML) are integral to modern applications. By integrating AI and ML into your modernized application, you can unlock new levels of innovation, fostering customer engagement and staying ahead of the curve by offering dynamic and intelligent solutions.
While technology is transforming and evolving at shocking speeds, that doesn’t mean you need to rebuild your tech stack from scratch. Application modernization allows you to leverage the latest technology while still utilizing your current platforms. It is vital to any enterprise’s long-term strategy to help improve security, productivity, user experience, and scalability.
See an error or have a suggestion? Please let us know by emailing splunkblogs@cisco.com.
This posting does not necessarily represent Splunk's position, strategies or opinion.

The world’s leading organizations rely on Splunk, a Cisco company, to continuously strengthen digital resilience with our unified security and observability platform, powered by industry-leading AI.
Our customers trust Splunk’s award-winning security and observability solutions to secure and improve the reliability of their complex digital environments, at any scale.

Get the latest articles from Splunk straight to your inbox.
© 2005 - 2025 Splunk LLC All rights reserved.