How to Use Tags to Speed Up Troubleshooting
Observability Jennifer ElkhouriMaybe as a kid, you pretended to have a magic wand. You would say something like, “Show me the answer to this long division question” then wave your magic wand and wait for the answer. Sadly, mine never seemed to work – for math questions or to make magical snacks appear. Now, imagine if you had a magic wand for your application stack where you could ask it a question about your data and it would give you immediate insights. Unlike the magic wand of our childhood years where snacks would not appear at the wave of a wand, this wand actually works and actual troubleshooting insights can appear instantaneously.
A Magic Wand for Your Applications
What if you could ask this magic wand, “In my canary deployment, am I seeing errors in my newly deployed version?” Or, “For my payment service, am I seeing latency in one region vs. another?” With Splunk Application Performance Monitoring (APM), you get your very own magic wand with our Tag Spotlight feature. By tagging certain span tags of interest, Tag Spotlight can provide valuable insights to help you reduce your MTTD and MTTR. In this blog post, we’ll walk through how to index a span tag to enable the use of Tag Spotlight for your application. We will also cover the types of span tags you should index as well as the types of span tags you should not index.
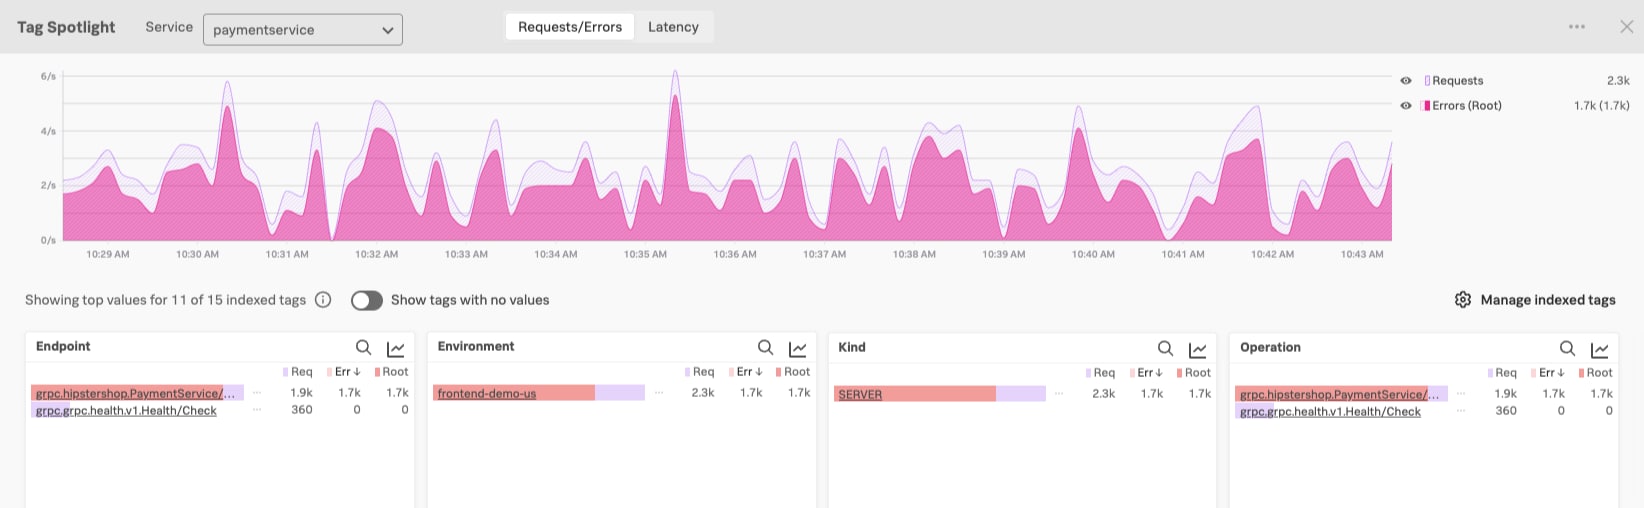
Out of the box, Splunk APM automatically indexes six span tags as your trace data flows into Splunk Observability Cloud:
- Environment (ex: dev, test, prod)
- Endpoint (ex: /auth/valid, /checkout/{cartId})
- Operation (ex: /auth/valid, /checkout/{cartId})
- HTTP Method (ex: GET, POST, PUT)
- Kind (ex: server, client, producer)
- Service (the name of the instrumented APM service)
As soon as you send trace data to Splunk APM, you immediately gain insights into errors and latency for these six tags.
Top Down vs. Bottom Up
Too often, we want to start our troubleshooting from a trace – or the bottom-up approach. That’s not always a bad approach but it often leads to increased MTTR as a single trace cannot show you enough about your application trace data to quickly guide you to the root cause. Another bottom-up approach is to search through trace data to manually find similarities, which can also be time consuming. A more efficient approach is to start top-down.
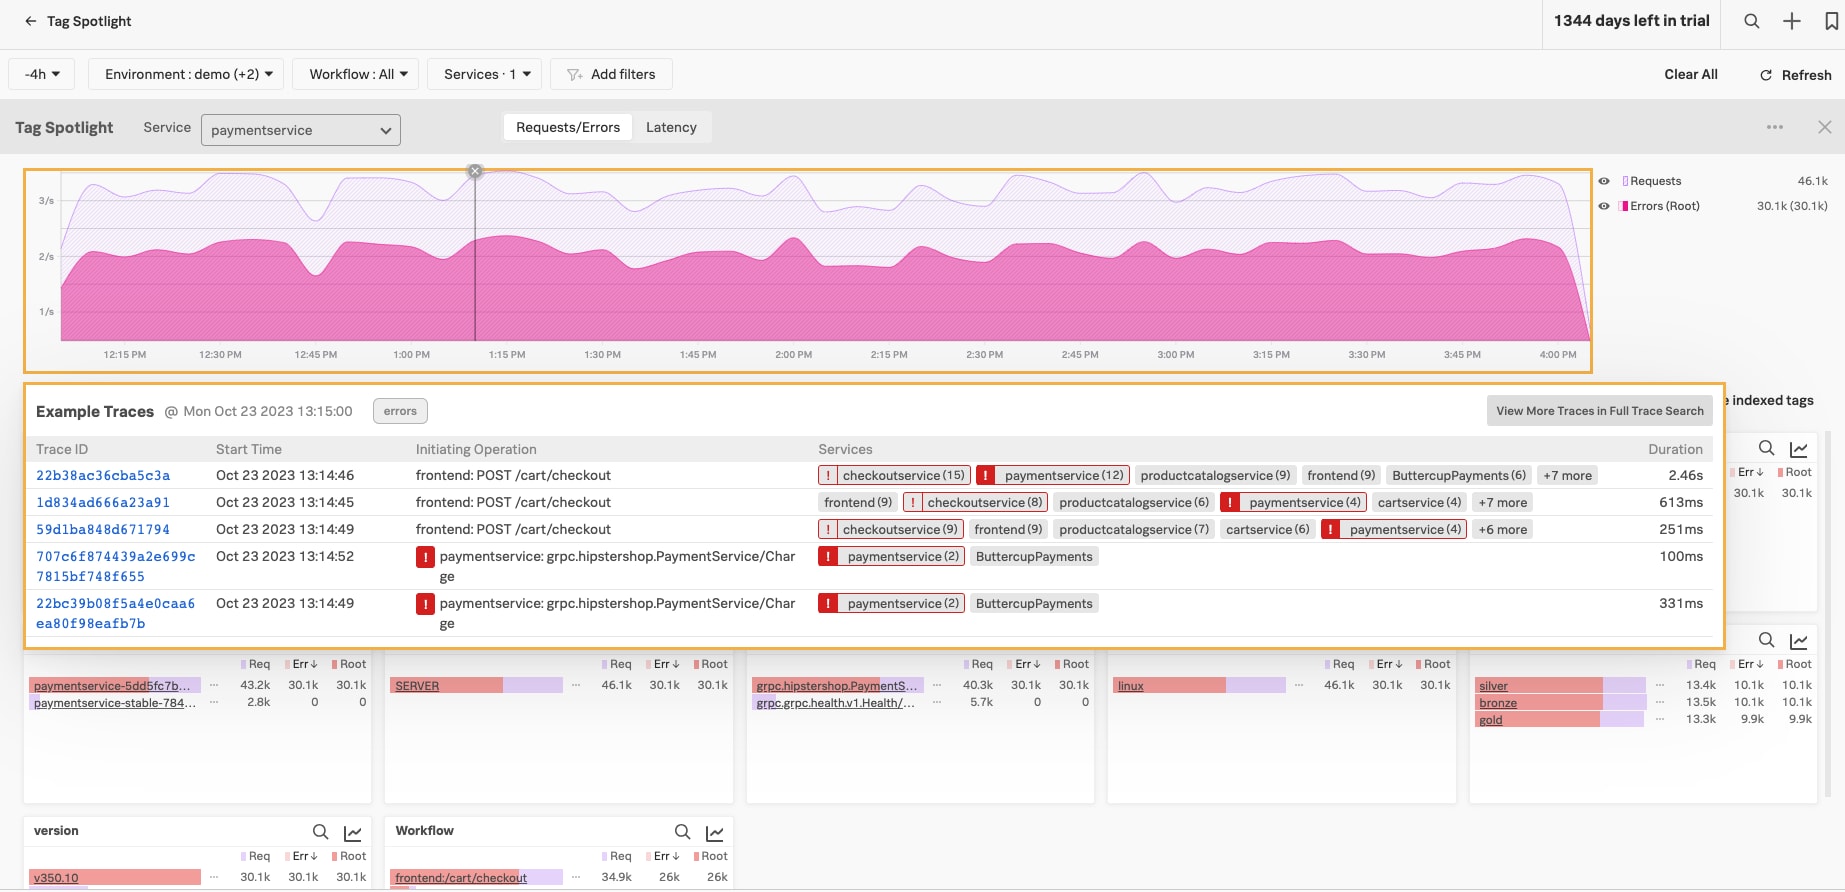
Splunk APM’s Tag Spotlight offers a top-down view of your trace data. Using Tag Spotlight, you can quickly identify issues across various categories of data, such as Kubernetes pod or endpoint. From this view, you can drill down to look at individual traces that are representative of an issue.


But perhaps you want to gain additional insights into your application trace data beyond these default indexed tags. Let’s say your organization tracks customer status, such as Bronze, Silver, and Gold level customers, and you want to see errors or latency broken down by customer status. Or, maybe you want to track latency and errors by application version in the event you deploy multiple versions of your application simultaneously (such as with canaries or for blue/green testing). With Splunk, you can easily index span tags to gain superpower insights into your application data.
Indexing a Span Tag and Enabling Tag Spotlight
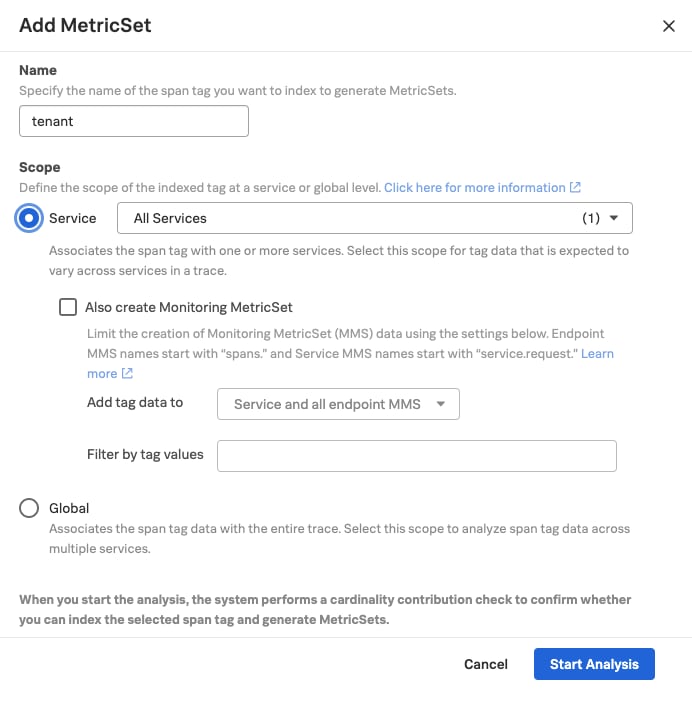
You will need to be an Administrator in Splunk Observability Cloud to index span tags, or at least know an admin you can bribe with coffee or snacks. When you index a span tag, Splunk Observability Cloud creates a Troubleshooting MetricSet, and out of the box you get the RED (Request, Error, and Duration) metrics for every indexed span tag: Request rate; error rate; root cause error rate; p50, p90, and p99 latency.

- To start indexing a span tag to create a Troubleshooting MetricSet, you’ll first access the APM MetricSets configuration by selecting APM Configuration from the APM Overview page, selecting Settings in the left navigation bar and selecting APM MetricSets under Data Configuration, or clicking the Manage indexed tags link from Tag Spotlight.
- Once on the APM MetricSets page, simply select New MetricSet.
- Next, you’d enter your inputs for Name and Scope. In the Name field, enter the name of the span tag you want to index, for example, “tenant”. In the Scope section, select either Service or Global. Selecting the Service option means that the value of your span tag may change across a given trace whereas selecting the Global option means that the value of the span tag will be the same across all services in a given trace.
- If you select the Service option, you can choose the All Services option to index the span tag for every service or specify one or more services.
- Selecting Start Analysis will run an analysis of the span tag you’re creating. Splunk Observability Cloud will then calculate the potential cardinality of the proposed span tag you want to index. (We’ll talk more about why this matters later!)
- Once the cardinality check is complete, you can choose to either cancel or enable the Troubleshooting MetricSet.
Mega Insights Delivered
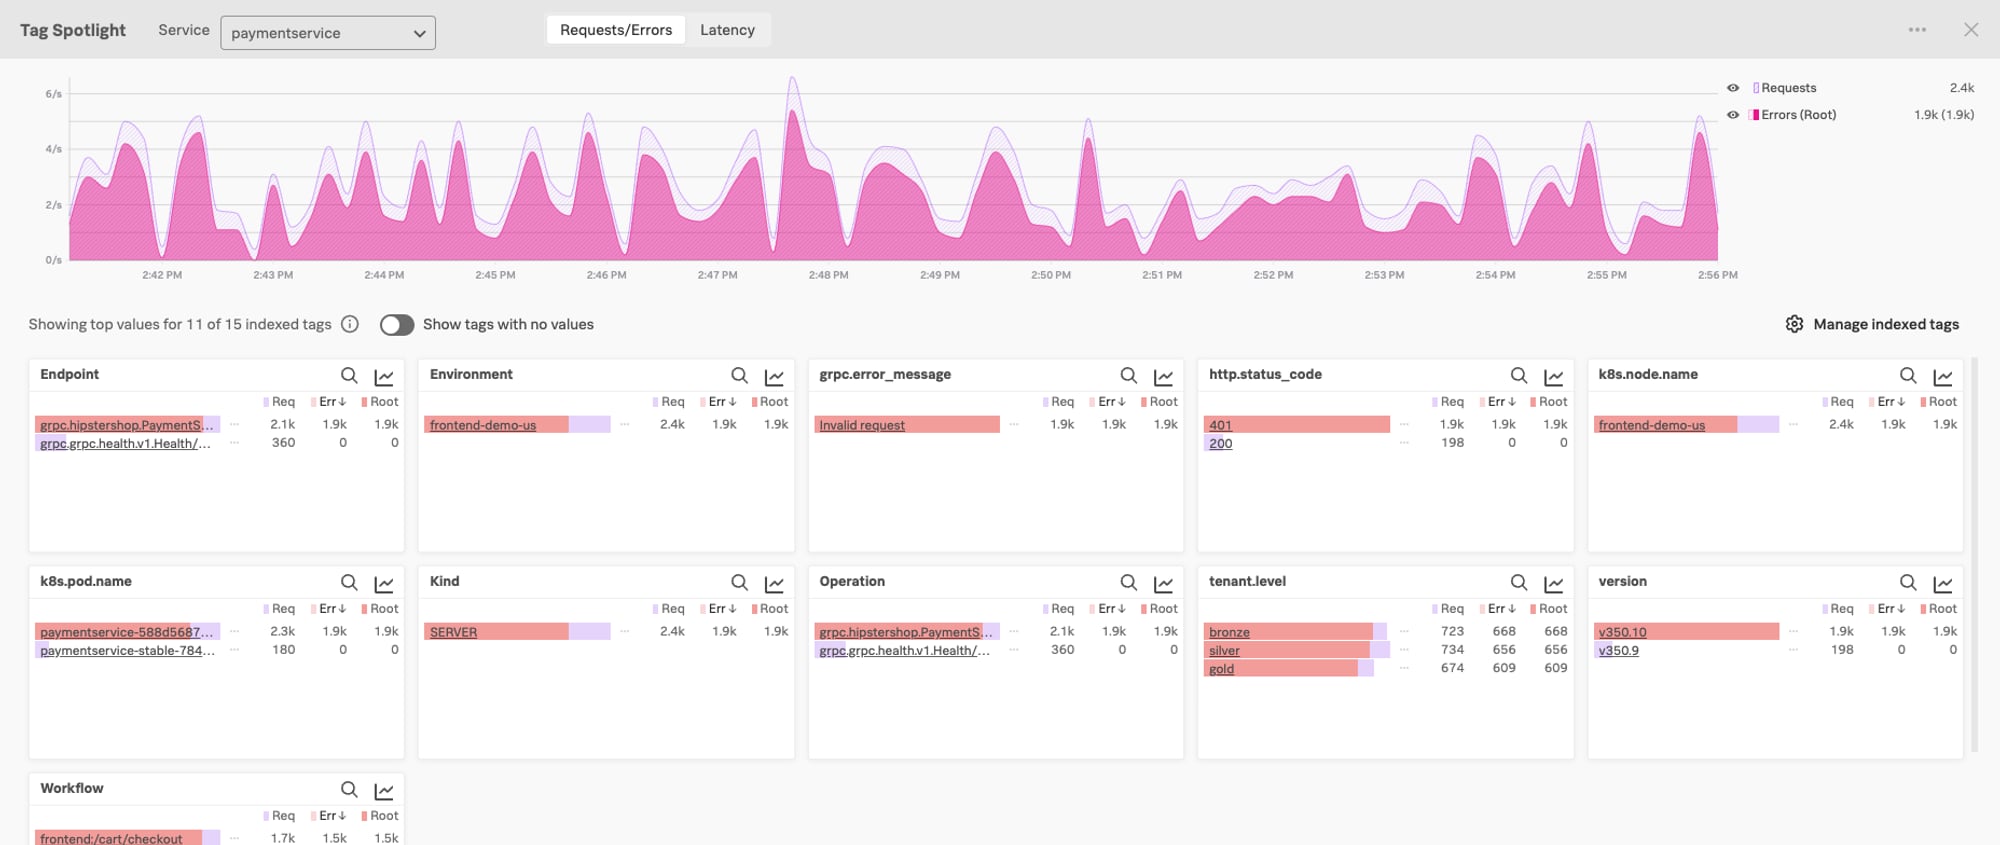
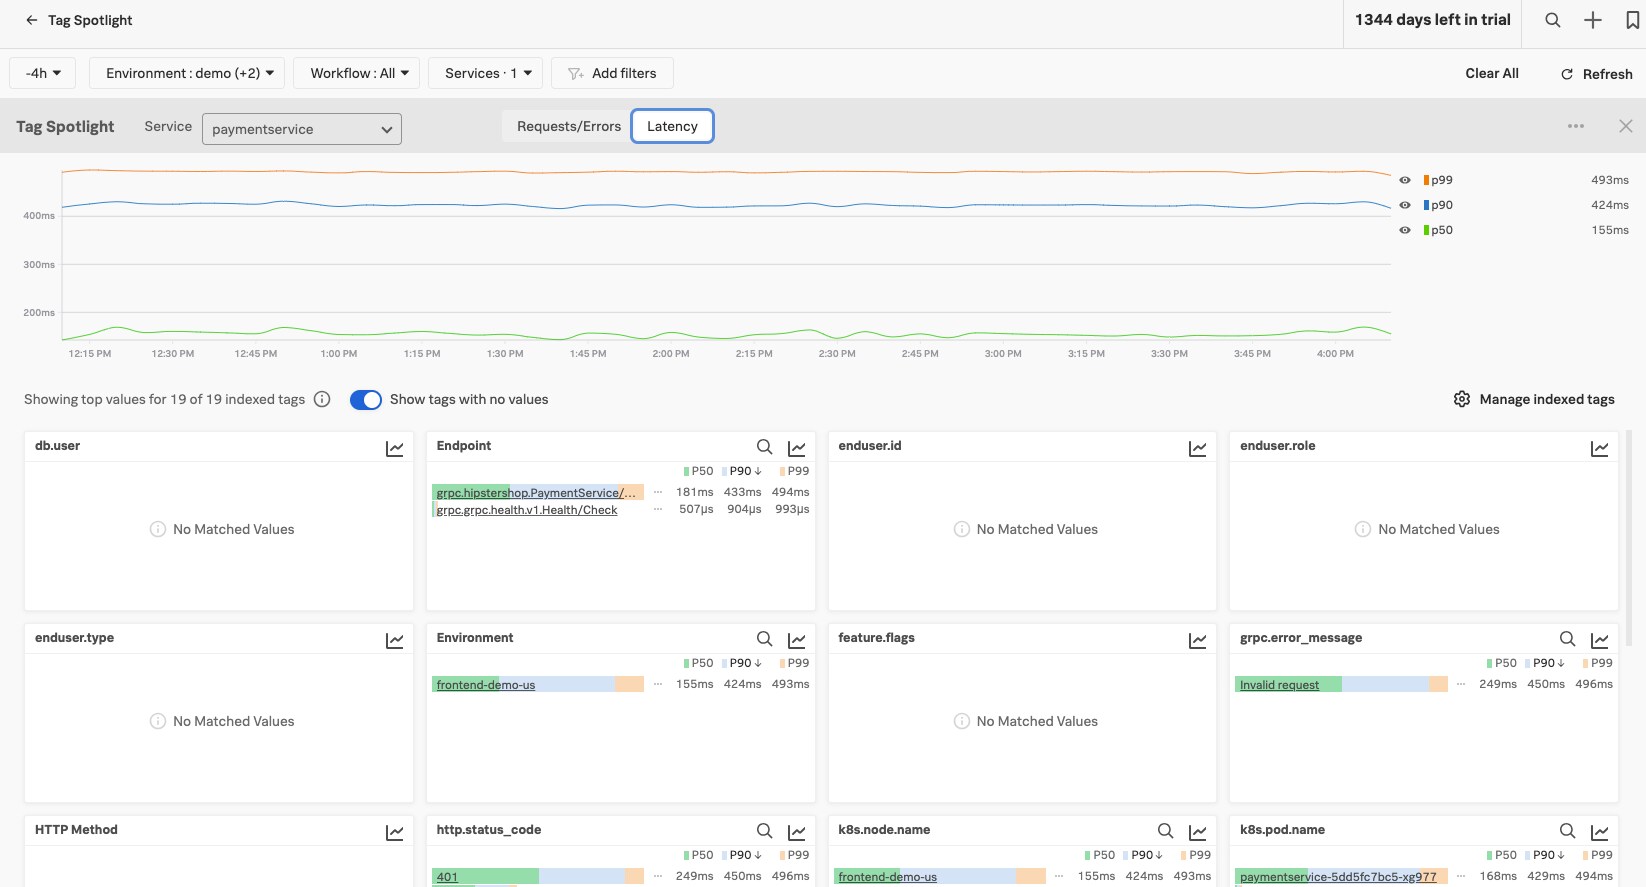
Once you’ve created a Troubleshooting MetricSet, navigating to Tag Spotlight will deliver a host of insights. In this example, we’ve created a Troubleshooting MetricSet for “tenant”. You can quickly gain insights into errors based on these tags and by clicking the Latency tab, you can also see traces broken down by indexed span tags and by latency. Looking at the tenant-indexed span tag, we definitely see that all tenants, regardless of level, are experiencing errors.


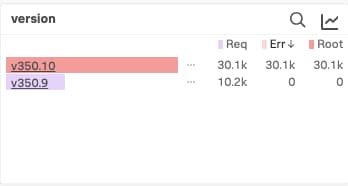
In another example below, you can see the power of Tag Spotlight in assessing the health of a canary deployment. Thanks to the NoSample architecture of Splunk Observability Cloud, you’d be able to see every single trace and easily identify, in this case, that the service in version 350.10 is ending in an error state while version 350.9 is reporting zero errors. This would be a clear indicator that something is wrong with the newly deployed version.

To Index or Not to Index … That is The Question
At this point, you are probably super excited to jump in and index every tag within your application’s traces. I love your enthusiasm! As with anything, however, there are best practices for choosing which span tags to index. Generally, indexing low to moderate cardinality span tags is always best practice. But, that doesn’t mean you should index every single low cardinality span tag. Think through span tag values that would be helpful in troubleshooting when an incident occurs, such as application version if you run canary deployments, or Kubernetes pod name if you deploy your application in Kubernetes, or perhaps cloud provider region if your application is hosted in the cloud. You can even index a span tag such as product_category if you are looking to understand latency or errors for a particular product category. These are all good options as they are usually low cardinality and can often point you exactly to the root cause when troubleshooting.
That leaves us with the question: what tags shouldn’t we index? You have probably already guessed that it’s best practice to avoid indexing high cardinality or ephemeral tag values. One example of a high cardinality span tag is container_id in a Kubernetes environment. Containers can have a pretty high churn rate and therefore generate many unique values. Indexing something like container_id likely would not provide helpful insights when troubleshooting while negatively impacting storage costs and query performance.
Handing You the Magic Wand
Now that you know what span tags you should index and how to index them, it’s time to go wave the magic Tag Spotlight wand to see what insights you can find in your applications using Splunk Observability Cloud. Start a free trial today!