Monitor Cloud-Native & Hybrid Apps and Business Transactions With Observability Cloud APM
Observability Wei LiThis blog was co-authored by Deena Shanghavi and Bob Ni.
As organizations modernize, most applications don’t fit neatly into one category—they span both traditional three-tier architectures and cloud-native microservices. To monitor these hybrid environments effectively, teams need APM tools that can seamlessly connect the two worlds.
That’s why at .conf25, we’re introducing new capabilities in Splunk Observability Cloud to strengthen APM for cloud-native applications and extend support for hybrid environments —building on AppDynamics’ proven expertise in monitoring traditional three-tier applications. These updates bring greater visibility and precision to monitoring, from business transactions down to code-level execution.
Highlights include:
- Business Transactions – flexible, precise monitoring of business workflows
- Call Graphs – code-level insights for faster root cause analysis
- Service map grouping – visually organize related services using indexed span tags and monitor the health of each group
- Service instance visibility – correlate application and infrastructure data more effectively
Together, these capabilities deliver a unified APM solution for organizations running hybrid or microservices-centric applications.
Monitor Business Transactions With Precision
Monitoring individual services in isolation makes it difficult to understand how application performance impacts the business or to prioritize where to focus your efforts. You need visibility into the end-to-end business transactions that span multiple services and directly impact your customers.
In Splunk Observability Cloud, a Business Transaction group a set of related traces that track a discrete transaction or user flow of interest. We’ve evolved the former Business Workflow feature in Splunk APM to Business Transactions, introducing a dedicated view and giving you more flexibility in how you define and monitor them. This makes it easier to monitor and troubleshoot key operations such as checkout.
Example: Imagine you’re an SRE for an e-commerce application. Instead of setting up alerts for individual services—which creates a lot of noise—you configure detectors for critical business transactions such as order confirmation. One day, you receive a critical alert about high latency in your order confirmation transaction. Clicking the link in the alert email takes you directly to the overview page for that business transaction.
On the overview page, you see:
- A map view that visualizes all the services powering the transaction.
- Transaction metric charts that track RED metrics (request rate, errors, duration).
By quickly comparing latency across services in the transaction, you notice the most upstream service, ecommerce-green-svc, shows the highest latency. You can now narrow the issue down to that service for deeper troubleshooting.

The Business Transaction overview page tracks transaction-level RED metrics, including latency comparisons across services.
Gain Code-Level Insights With Call Graphs
In APM, tracing helps you see where latency or errors occur across distributed services but it doesn’t always reveal what’s happening inside the code itself. That’s where Call Graphs come in. A Call Graph provides a detailed breakdown of the execution path for a single span of a trace, at the code level.
We’re introducing Call Graphs in Splunk APM to help you go beyond a slow trace and pinpoint the exact function or method inside a service that’s causing the slowdown.
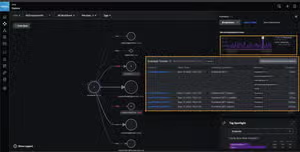
Example (continuing from above): You already know the ecommerce-green-svc service is the source of the problem. You drill into the service-centric view of ecommerce-green-svc to investigate further. After confirming the service is unhealthy and showing elevated latency, you analyze relevant traces. The Traces view automatically surfaces problematic traces for the service, so you click on the longest trace to understand what happened.

The Traces view automatically surfaces problematic traces for the selected service
In the Trace Waterfall View, you see that most of the time was spent in the root span, which contains a call graph (marked with a blue notebook icon). Reviewing the call graph, you find a single method - sun.nio.ch.Net.connect0(Net.java:0)causing the majority of the latency. With this insight, you can work directly with the team that owns this code to resolve the issue.

The call graph provides a detailed breakdown of the execution path.
See Complex Architectures Organized the Way Your Teams Work
In large, distributed environments, hundreds of services often appear as an unstructured list, making it difficult to quickly understand relationships, identify ownership, or connect technical issues back to business domains. Without logical grouping, troubleshooting is slower, dashboards become cluttered, and teams waste time sifting through noise.
To address this, we’re introducing the ability to use indexed span tags such as service.namespace to group related services on the Service Map. This adds structure and context to your observability data, transforming a messy list of services into a clear, business-aligned view of your system.
With service map grouping, you can create conceptual views that align with how your teams work. For example, you might group all checkout-related services together to monitor performance as a unit and see how they affect one another. Because different teams or business units often own different namespaces, grouping also clarifies ownership and reduces noise from unrelated services.
Once services are grouped, you can monitor their health at a glance. A multicolored ring around each group shows the percentage of services in red (critical), orange (warning), or gray (normal) health states. Selecting a service group reveals aggregated request and error metrics for the group, along with a list of the services it contains.

Service map grouping lets you group related services by indexed span tags to align with how your teams work.
Correlate App and Infra Data With Service Instance Visibility
In modern distributed environments, applications don’t run on a single server—they run across hundreds or even thousands of service instances, often in containers or ephemeral infrastructure. Looking only at aggregate service-level metrics can mask critical issues that affect just a subset of instances (for example, a single pod in Kubernetes or a VM in a cluster).
To solve this, we’re introducing a new Instances tab in APM that brings together service instance and infrastructure metrics in a single view so you can pinpoint issues faster.
The Instance tab provides a searchable table of all service instances, showing their request, error, and duration (RED) metrics alongside infrastructure data such as CPU, memory, and host ID. With direct correlation to infrastructure monitoring, you can quickly confirm or rule out whether infrastructure is the cause of application issues.

Monitor Any Applications With Splunk APM Now
With these innovations, Splunk APM delivers best-in-class support for both cloud-native and traditional three-tier applications—giving you one unified platform to monitor any app, in any environment.
Start a free trial or schedule a demo today.
Follow all the conversations coming out of #splunkconf25!
Related Articles

OpenTelemetry, Auto-Instrumentation and Splunk Observability Cloud: A Jump Start

How Does Observability Help an Organization Move the Needle?
