Enterprise Security Features
Explore detailed product features and in-depth workflows to see how Enterprise Security (ES) drives efficiency, precision, and impact across your security operations.

Deploy detections with confidence for faster mean time to detect. Get the complete detection lifecycle experience to enable engineers to seamlessly test, deploy, and monitor detections. Measure and enhance your coverage that maps to the MITRE ATT&CK® Framework — so that your team can keep pace with evolving TTPs and swiftly take action on detection gaps.

Learn how finding-based detections can help your security team quickly understand security incidents and respond accordingly. A finding-based detection is based on the specific detail or analytics observed, including timestamps key/value pairs, entity information, impact, risk score, threat object, and more.

Leverage and manage a full library of detections directly in Enterprise Security so detection engineers can seamlessly deploy and update content.

Learn how detection versioning can help you better manage detection hygiene in your SIEM. Automatic detection versioning provides native, automatic version control of ESCU and customer-owned detections. Detection engineers can easily and efficiently save new versions of detections, back up detections, roll back to prior versions of detections with a single click, and maintain custom detections.

The MITRE ATT&CK Framework feature in Enterprise Security allows security analysts to quickly build situational awareness around an incident in the context of the MITRE ATT&CK Matrix and pivot directly to associated MITRE documentation.

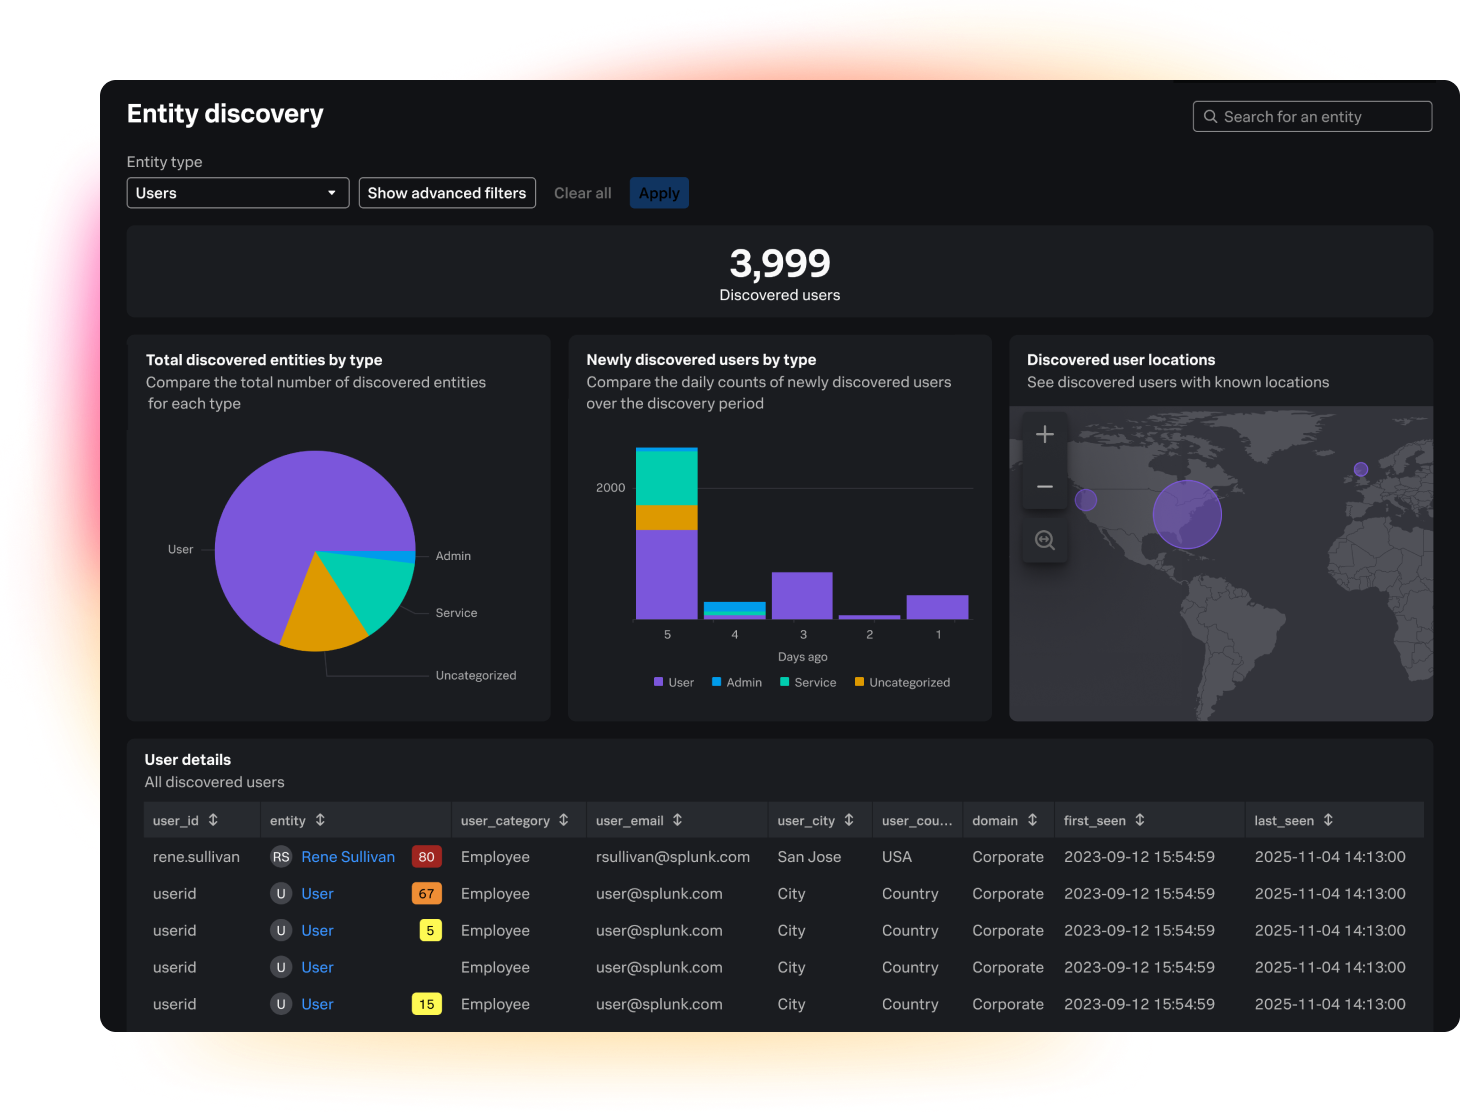
Built on a scalable platform, ES delivers data-driven insights so you can gain full-breadth visibility across your organization.
The Security Posture dashboard provides high-level insight into real-time notable events across your security operations center. You can configure the dashboard with the KPIs you need and monitor change over a 24-hour period.

Risk-Based Scoring (RBA) is a component of Entity Risk Scoring (ERS), which provides a weighted, explainable, and normalized score from a 0-100 model according to the findings associated with that entity. During an incident review process, you can easily expand the score to view the calculation details and the timeline of detection activity.

Access to threat intelligence provides SOC analysts actionable intelligence with associated normalized risk scores and the necessary context from intelligence sources that are required in order to detect, prioritize, and investigate security events. Analysts can fully investigate security events or suspicious activity by providing the relevant and normalized intelligence to better understand threat context and accelerate time to triage. Leverage intelligence from Cisco Talos to expand security coverage against evolving threats to uncover the unknown.

UEBA uses behavior-based anomaly detection and machine learning to detect subtle deviations in user and entity behavior, enabling early identification and neutralization of insider threats such as account misuse, compromised credentials, and lateral movement.

The Splunk Threat Research Team (STRT) are industry-recognized security experts who help security teams defend against threats by creating pre-configured detections so that analysts can easily integrate into their workflows enabling analysts to seamlessly investigate, respond to, and remediate threats. The STRT releases security content in the form of pre-packaged detections and responses to help your team stay on top of the latest threats.
Find this content in the Use Case Library in the form of Analytic Stories, where you can filter by use case or by an industry framework like MITRE ATT&CK.

In this SIEM in Seconds demo, we’ll explore the new and improved Analyst Queue in Splunk Enterprise Security. This is where security analysts spend the majority of their time triaging and investigating alerts. With our new right-hand side panel, analysts can consume all details of a finding and instantly kick off investigations and automate response.

In this SIEM in Seconds demo, explore how changes to investigative workflows in Splunk Enterprise Security allow for faster mean time to respond (MTTR) to incidents.

Threat Topology allows analysts to gauge the extent of an incident by mapping all the associated risk and threat objects. Analysts can immediately discover the scope of a security incident and quickly pivot between affected assets and users in the investigation, saving time and increasing productivity.

The Asset Investigator dashboard aggregates events over time into swim lanes for easier threat hunting and incident forensic. Each swim lane defines high and low activity periods by color shade, revealing patterns in host and user actions.
Within Security Domains are ready-to-use dashboards with individual focuses — such as tracking login attempts, breach endpoints or network intrusions — that you can pivot and correlate across to reduce remediation time.

SOAR orchestrates workflows and responses across your security and IT stack so that each tool is active in your defense strategy. Case management functionality uses workbooks to codify your processes into reusable templates. Whether you're using custom templates or industry standards for incident response, SOAR facilitates task segmentation, assignment, and documentation, ensuring a cohesive and collaborative investigative process.

Analysts are often overwhelmed with a large volume of security events. SOAR makes event management easy by consolidating all events from multiple sources into one place. Analysts can sort and filter events to identify high fidelity notable events and prioritize action.

SOAR apps have parameters for action inputs and outputs called "contains." These are used to enable contextual actions in the SOAR user interface. A common example is the contains type "ip." This is a powerful feature that the platform provides, as it allows the user to chain the output of one action as input to another.

Splunk Enterprise Security revolutionizes the SOC workflow experience, enabling security analysts to seamlessly detect what matters, investigate holistically, and respond rapidly. Elevate security operations with complete and unified TDIR workflows, simplified terminology, modern aggregation and triage capabilities, and enhanced detections. This comprehensive demonstration covers all features and capabilities of Splunk Enterprise Security.

See how Response Plans in Splunk Enterprise Security allow users to easily collaborate and execute incident response workflows for common security use cases. Response Plan templates allow users to see each phase of an incident response plan, assign key stakeholders to specific phases, and apply simple automation playbooks to tasks for rapid remediation.
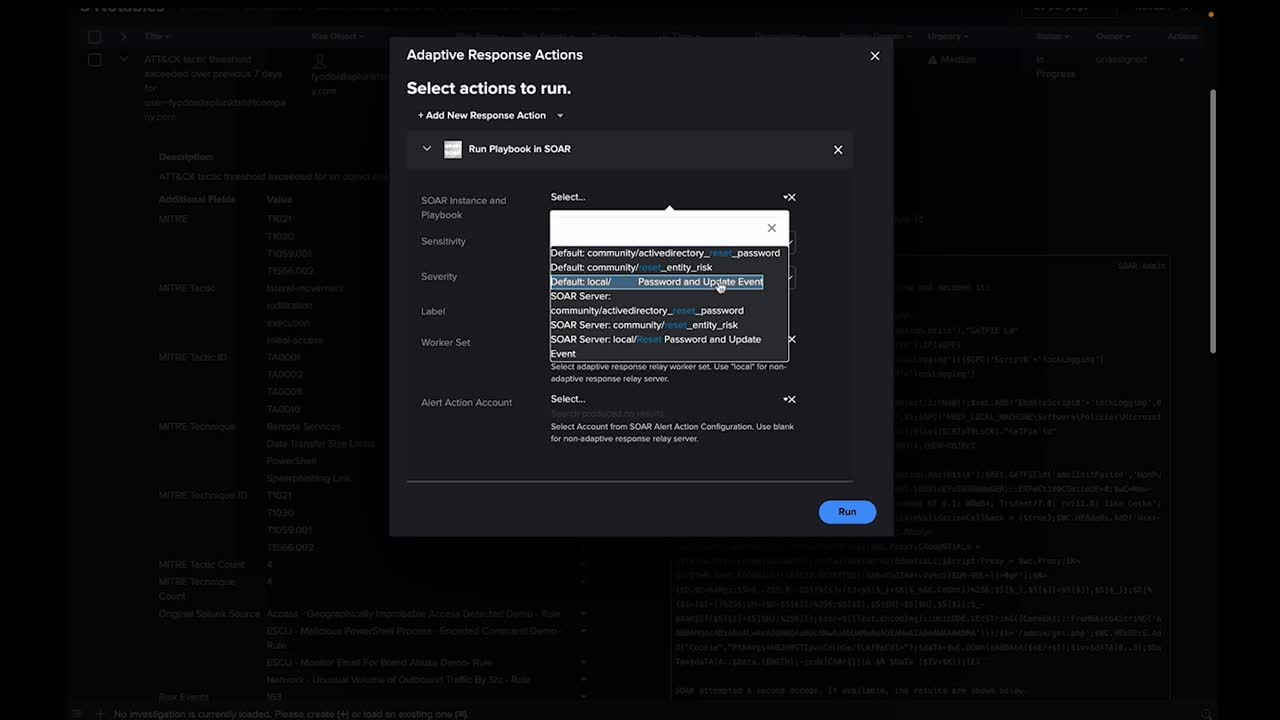
Adaptive Response Actions are actions that can be taken either manually or automatically against any notable event generated. These actions can help gather context or help accelerate response and remediation when investigating notable events and are a great foundation for automating certain processes before expanding to full security orchestration, automation, and response solution with Splunk Enterprise Security’s native SOAR capability.

Prompt-driven automation lets you send real-time, secure prompts to teams outside the SOC to streamline response workflows and resolve security incidents faster. Deliver prompts through any ITOps, ChatOps, or ticketing applications.

Guided automation unlocks a whole new visual experience overlaying real incident data atop the logical sequencing in a playbook. Analysts can drastically reduce the time to build automation and improve accuracy.

Automate security tasks to conquer complex workflows faster with SOAR playbooks. Leverage Splunk’s out-of-the-box SOAR playbooks, and easily build and edit playbooks in the Visual Playbook Editor.

Whether you’re new to coding or a Python expert, SOAR provides you with the means to create and customize playbooks. The Visual Playbook Editor simplifies the playbook creation process by allowing you to assemble custom workflows with prebuilt code blocks and action strings. It also features input playbooks for basic IT tasks, which can be integrated into larger playbooks and security workflows.

SOAR’s custom functions allow you to share custom code across playbooks while introducing complex data objects into the execution path. These aren’t just out-of-the-box playbooks, but out-of-the-box custom blocks that save you time and effort. These capabilities provide the building blocks for scaling your automation, even to those without coding capabilities.

Splunkbase features an extensive catalog of SOAR apps, which facilitate integration across 300+ third-party tools and support 2,800+ automated actions. This allows you to connect and coordinate complex workflows across your teams and tools, so you don’t need to rip and replace your existing stack.
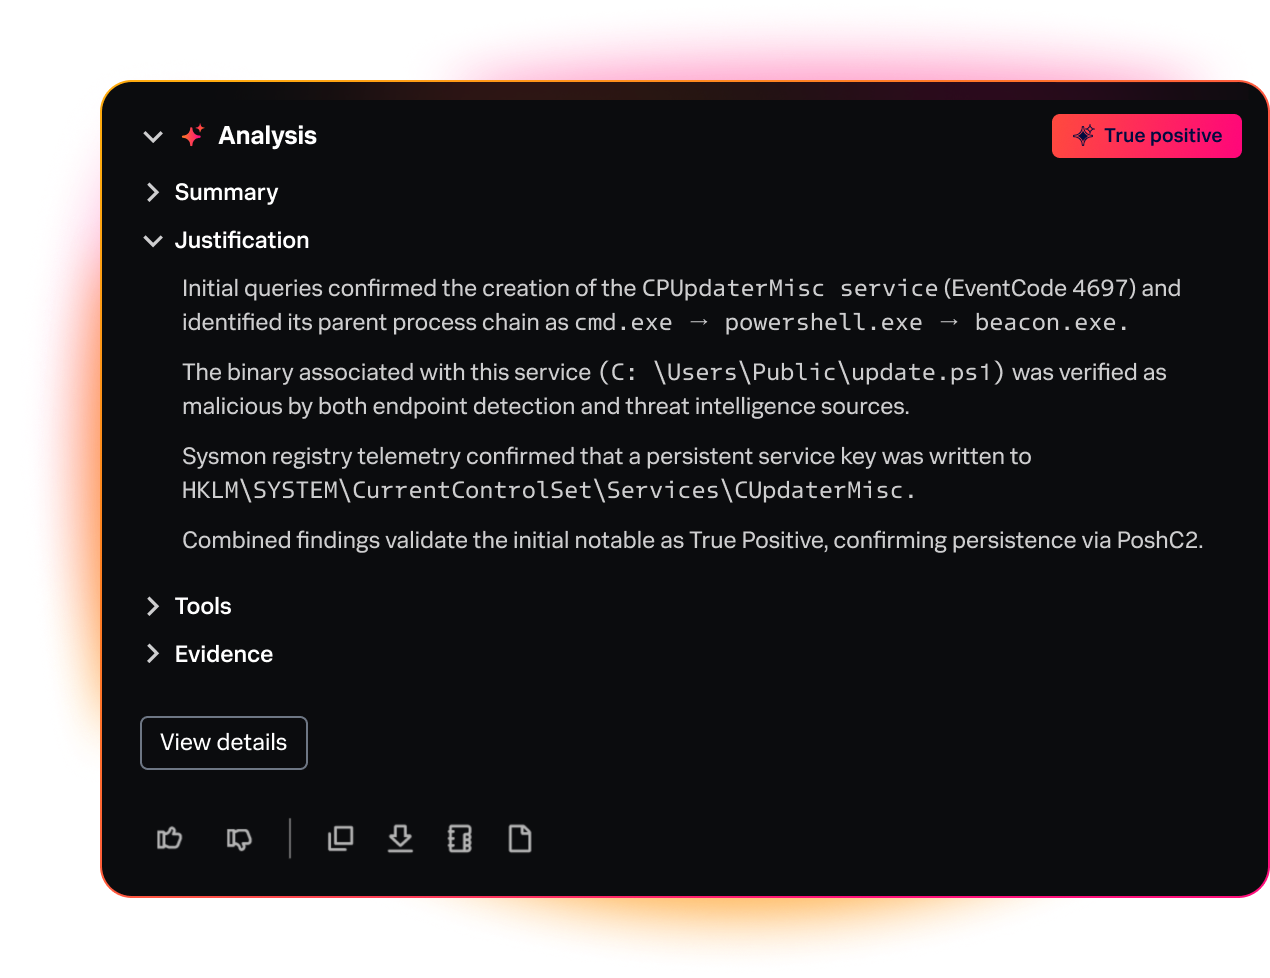
Splunk’s Triage Agent helps your analysts identify true positives faster so they can focus their attention where it matters most. The Triage Agent evaluates and explains alerts, prioritizes the most important ones, and even plans investigation steps, all while autonomously enriching each alert with valuable insights from your SOC’s security tools.
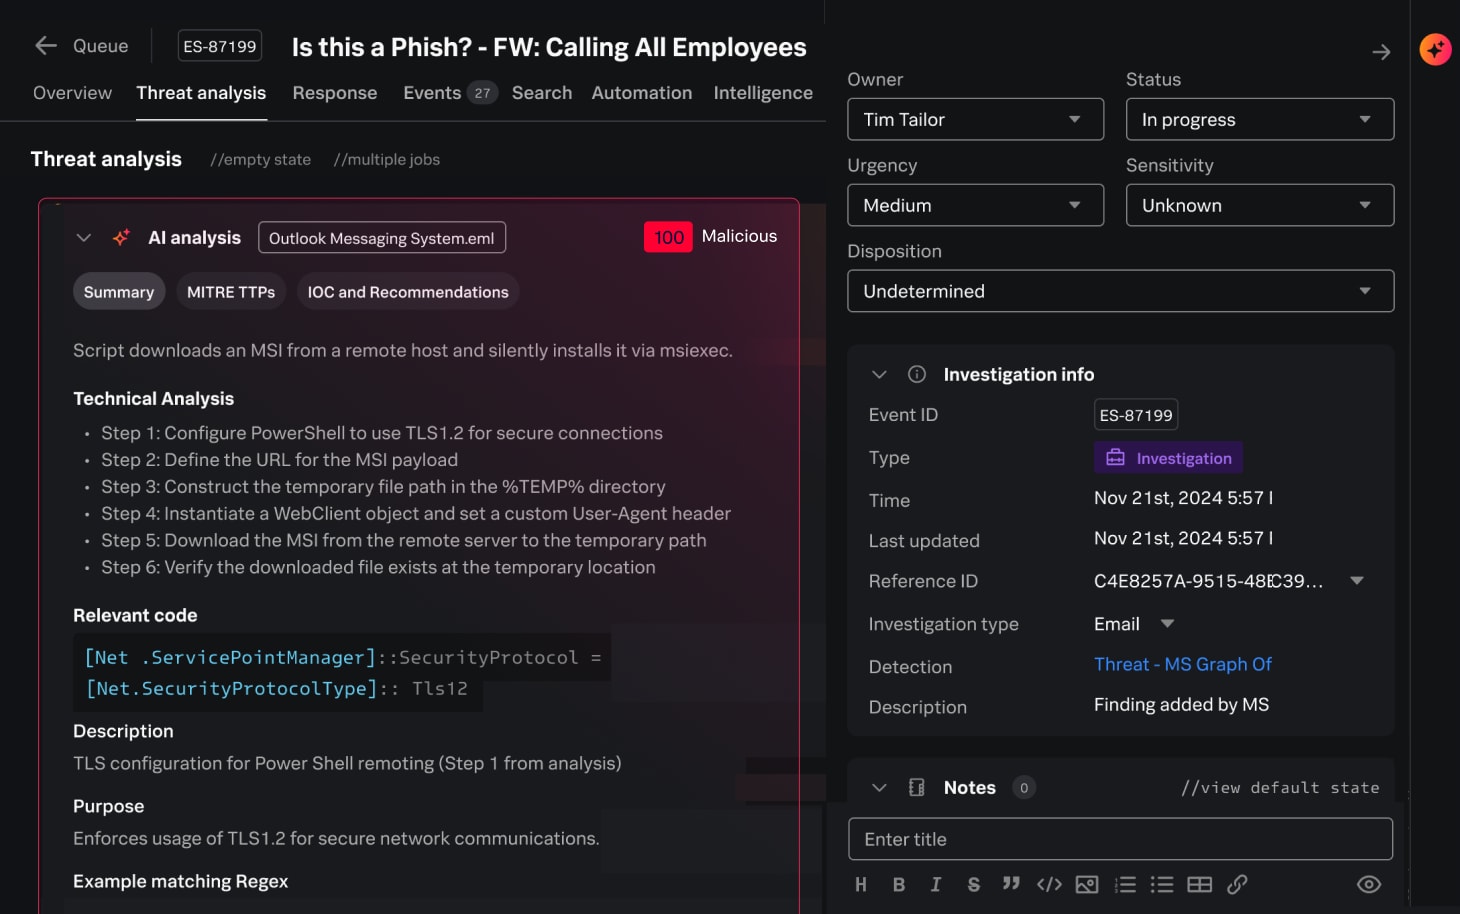
Get instant insights into malware behavior with AI-powered analysis. The Malware Threat Reversing Agent instantly summarizes threats — including high-level malware behavior insights and disposition recommendations — and accelerates triage and remediation with step-by-step breakdowns of malicious scripts.
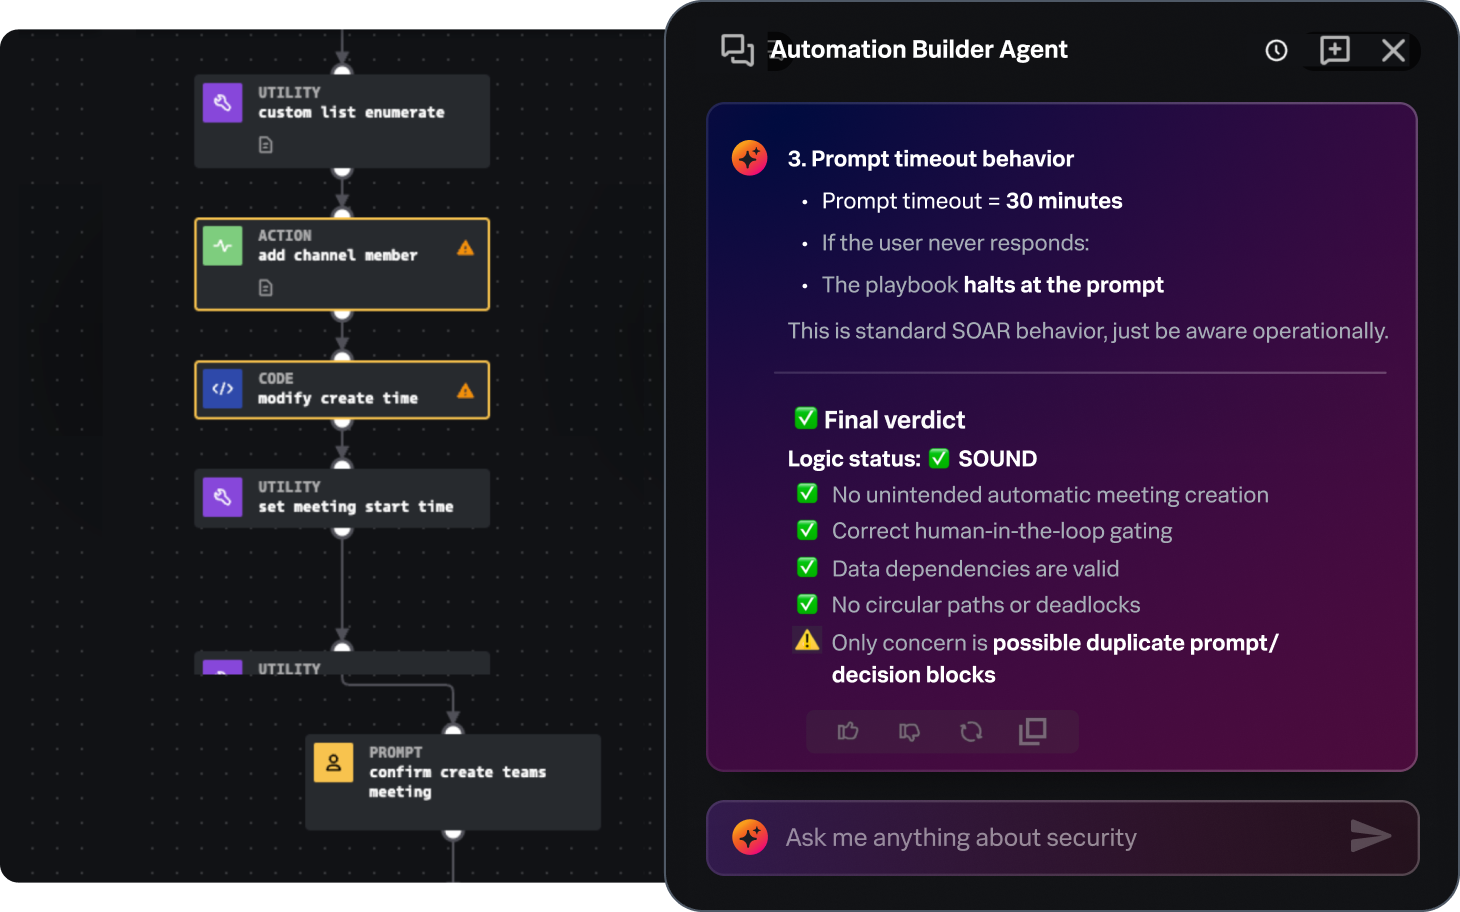
The Automation Builder Agent translates natural language intent into functional, tested SOAR playbooks. With this, you can build playbooks faster while also empowering more teammates to contribute to automation efforts, without needing deep Visual Playbook Editor (VPE) knowledge.
Automatically enforce and scale your standard operating procedures with Splunk’s Guided Response Agent. The agent executes SOC-defined actions to help teams contain threats with less manual work, while simultaneously ensuring your procedures are applied consistently throughout your team.

Don’t just automate — automate your way. With the SOP Agent, seamlessly integrate your standard operating procedures into Splunk Enterprise Security, so every autonomous response aligns with your team’s proven procedures. Achieve consistent, scalable containment with your protocols guiding every step.
© 2005 - 2026 Splunk LLC All rights reserved.