observability
Splunk Agent Observability
Observe, evaluate, and secure the agents, models, and infrastructure behind your AI.


Trust your agents in production
Reliable agents need more than one check. Splunk evaluates behavior, observes performance, tracks cost, and guardrails every agent on one platform, across 100% of your traffic.
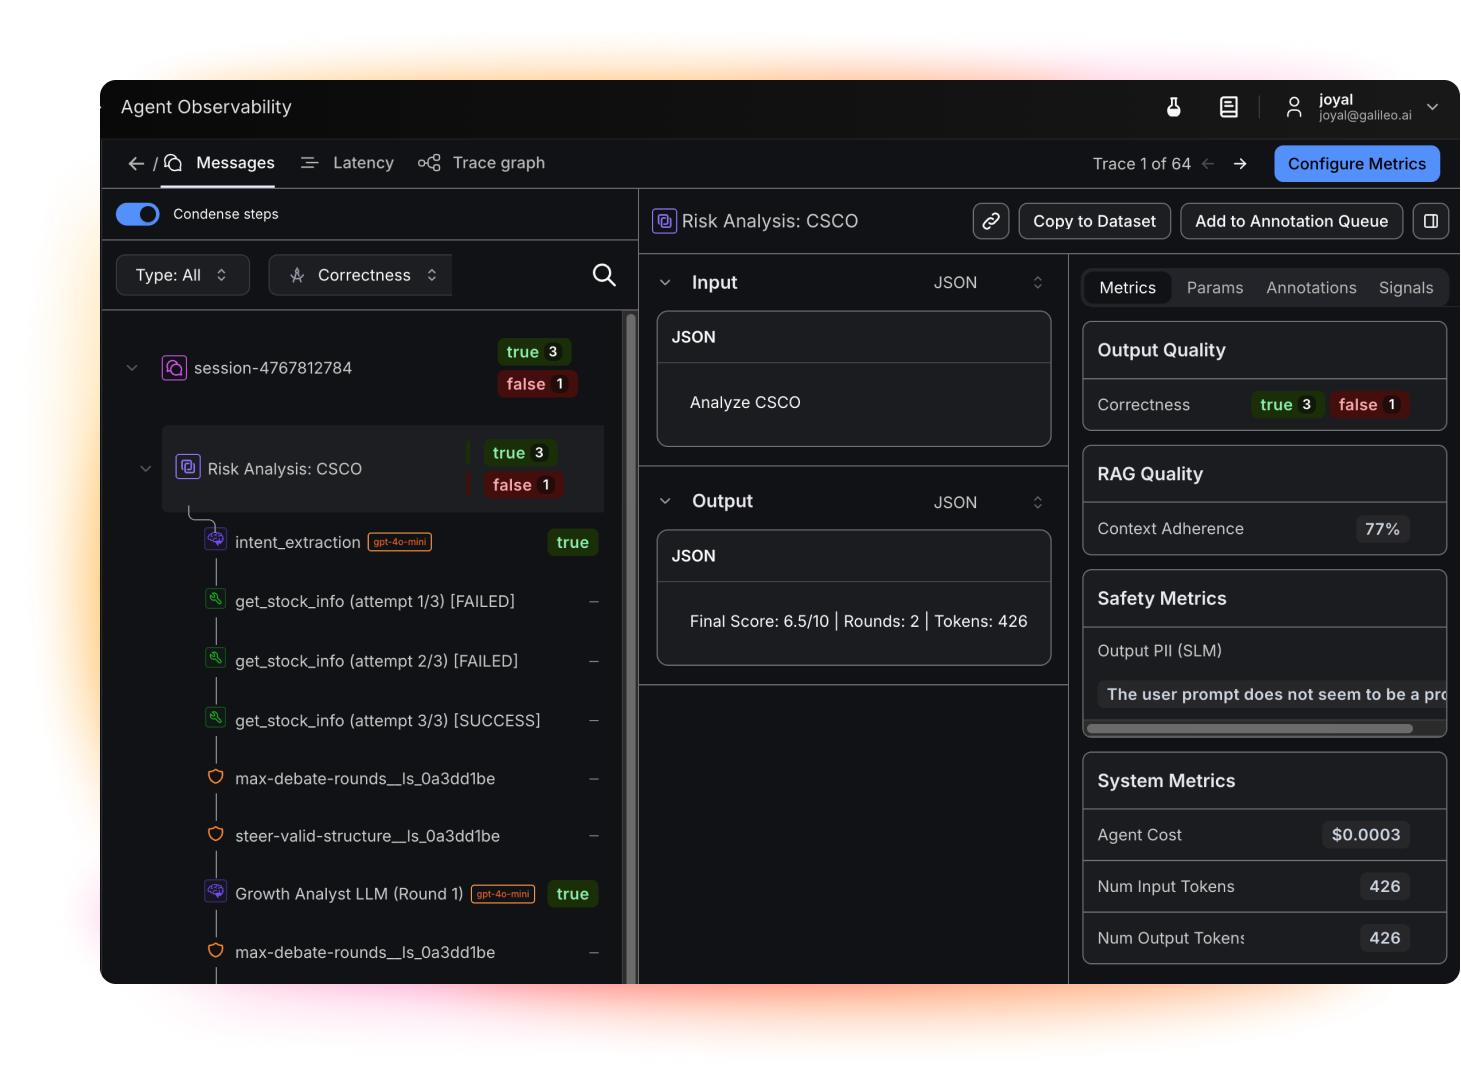
Find the root cause when an agent fails
Trace and map agent workflows from request to response, then pinpoint where quality, performance, or behavior broke down. Read latency and errors next to quality and security signals like hallucinations, bias, prompt injection, and PII leakage, so a failure points to its cause instead of a symptom.
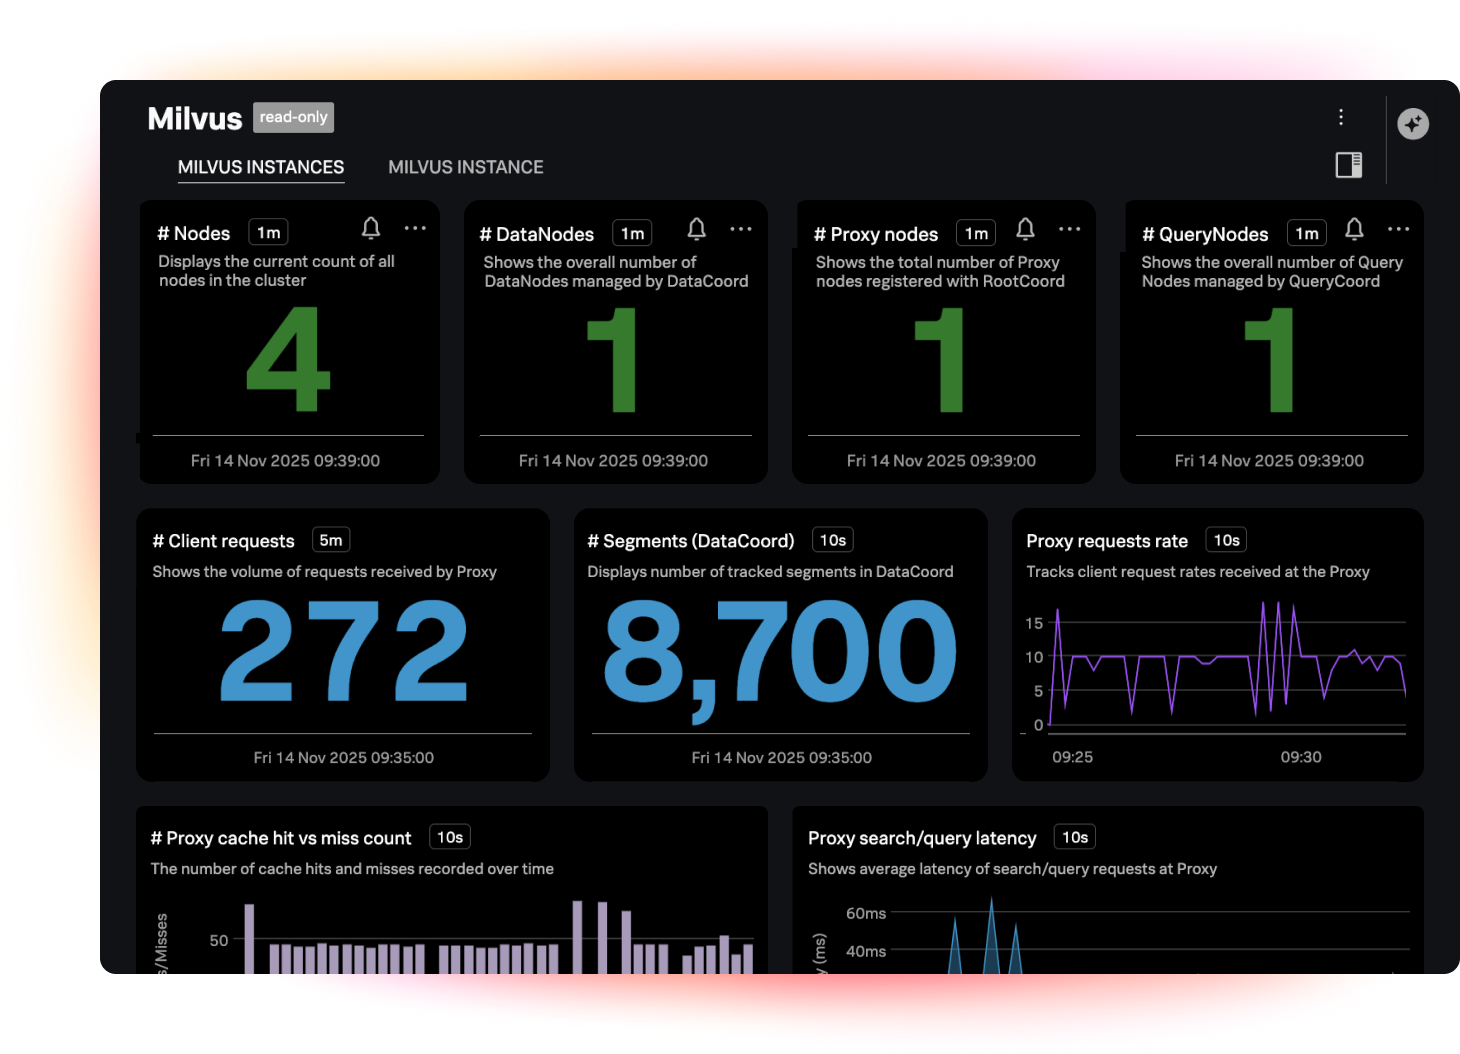
See the infrastructure underneath, down to the GPU
Track GPU and memory use, power, and latency across models, vector databases, and the rest of your AI stack. A token surge, a saturated GPU, and a slow response line up on one timeline.
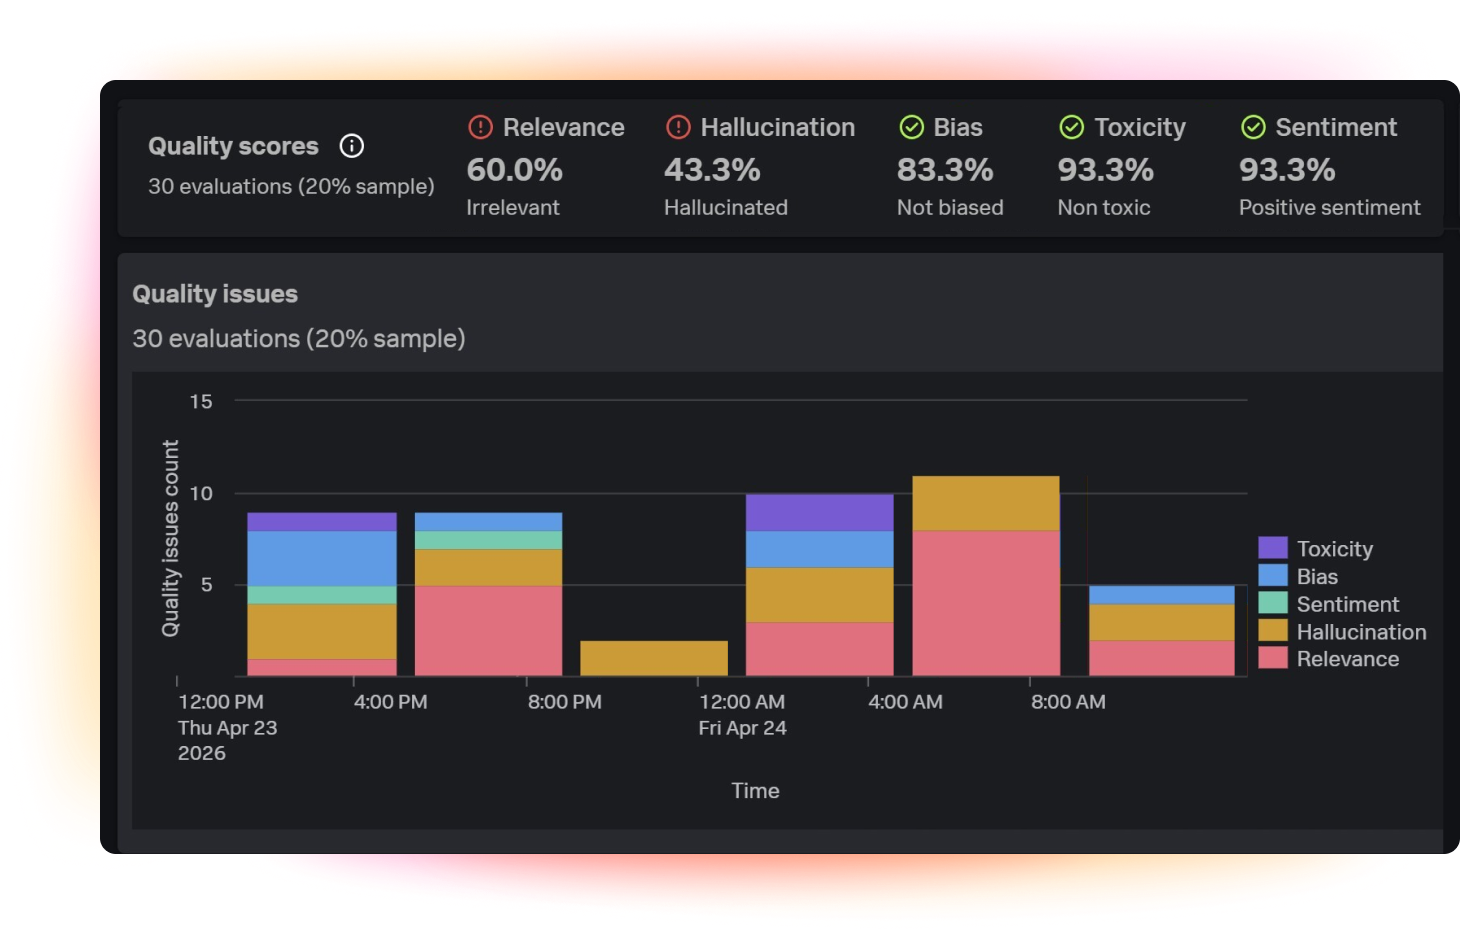
Evaluate and guard every interaction, affordably
Purpose-built Luna models score and protect 100% of traffic at a fraction of the cost of a frontier judge. Evaluation and guardrails run on every interaction in production, not a sampled slice.
Ensure AI performs as intended and at the right cost
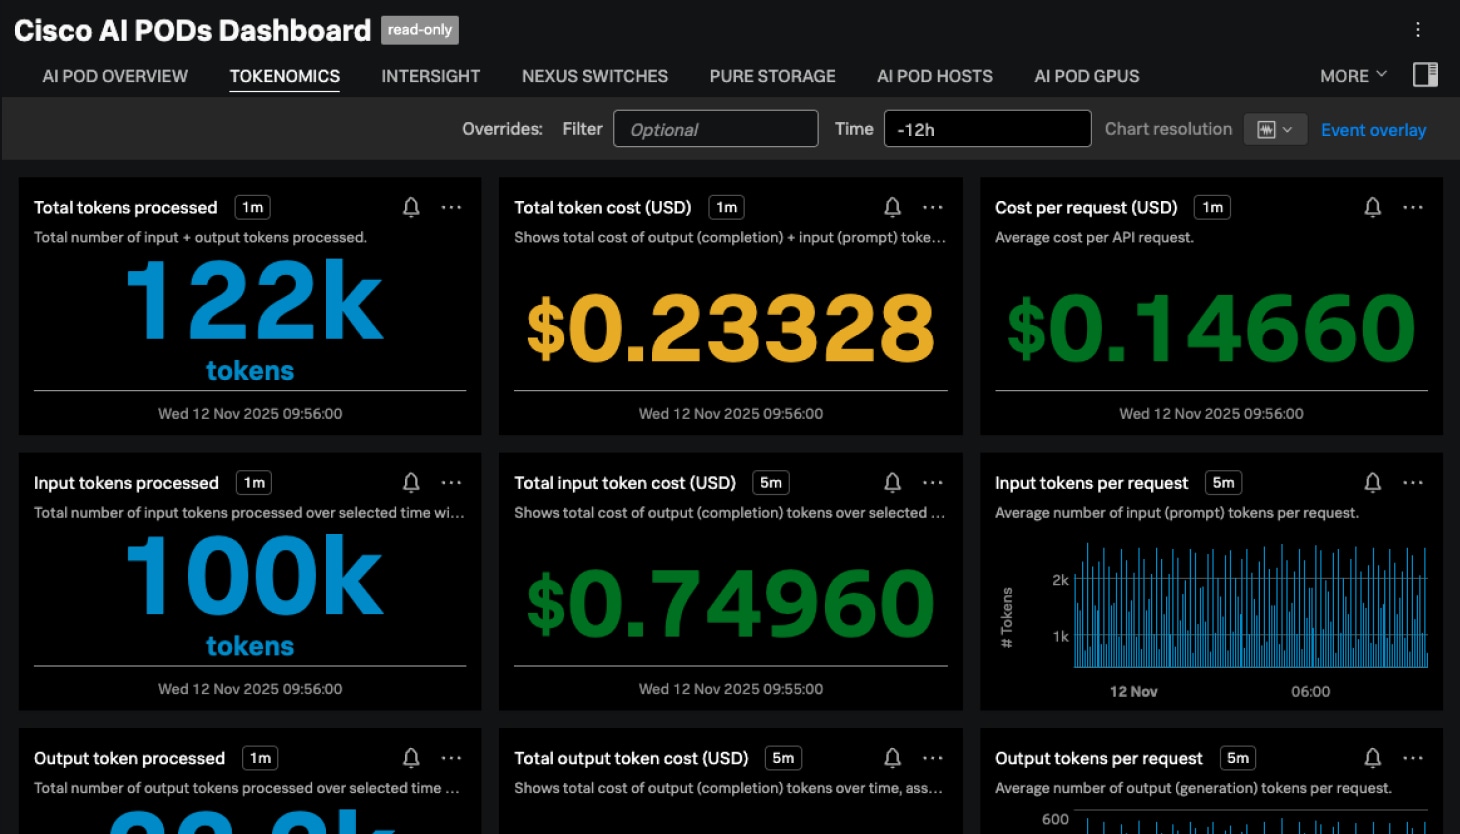
Tokenomics
View and manage token cost
Track token usage and cost by request, model, agent, and workflow. Read cost alongside quality so you can route each task to the right-sized model and catch runaway spend before the bill arrives.
Evaluation
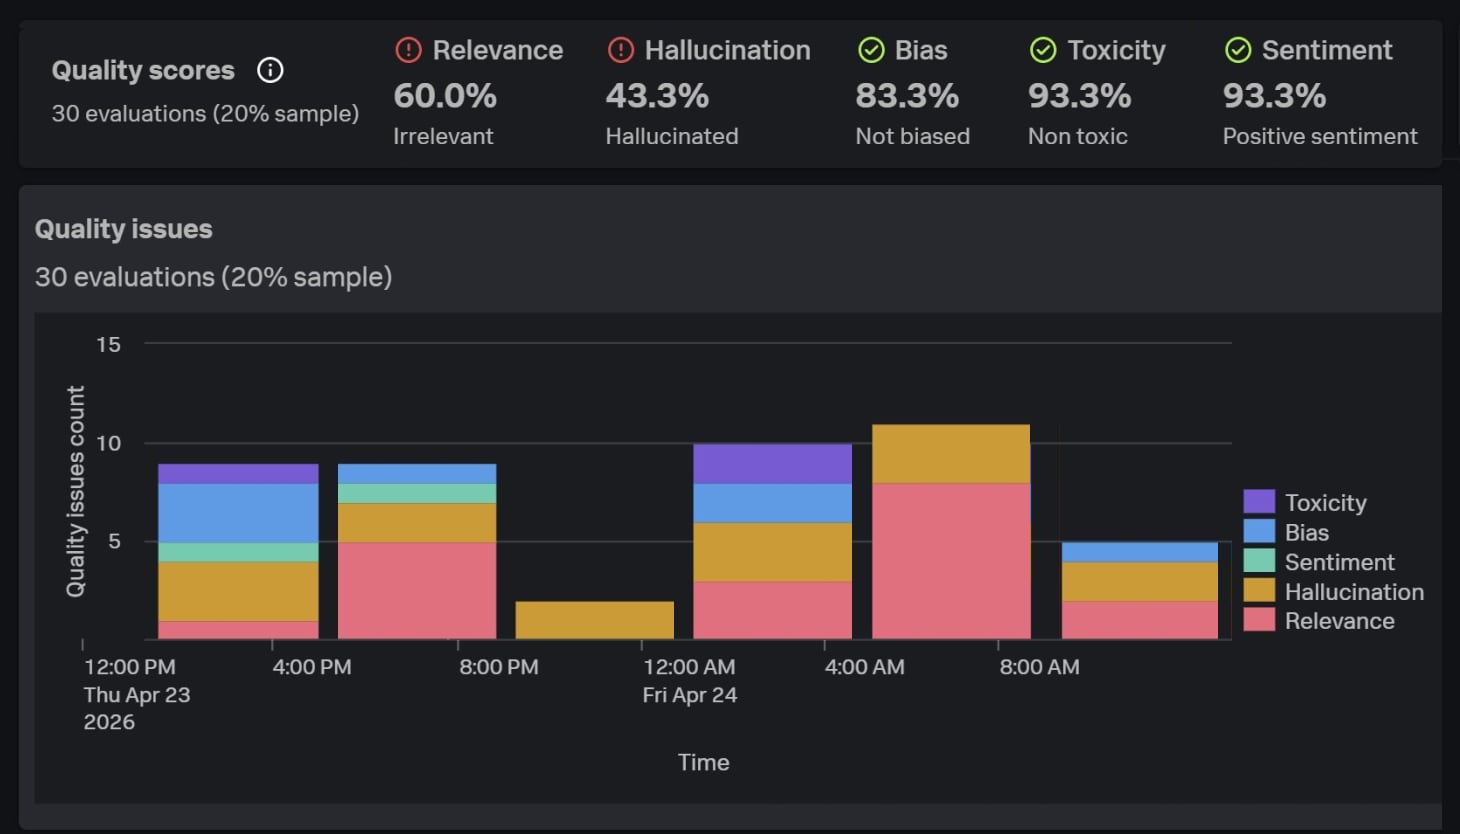
Know your agents are accurate
Score correctness, relevance, tool use, and safety with out-of-the-box and custom evaluators. Purpose-built Luna models make it affordable to evaluate 100% of traffic and calibrate metrics to your domain.
Visibility
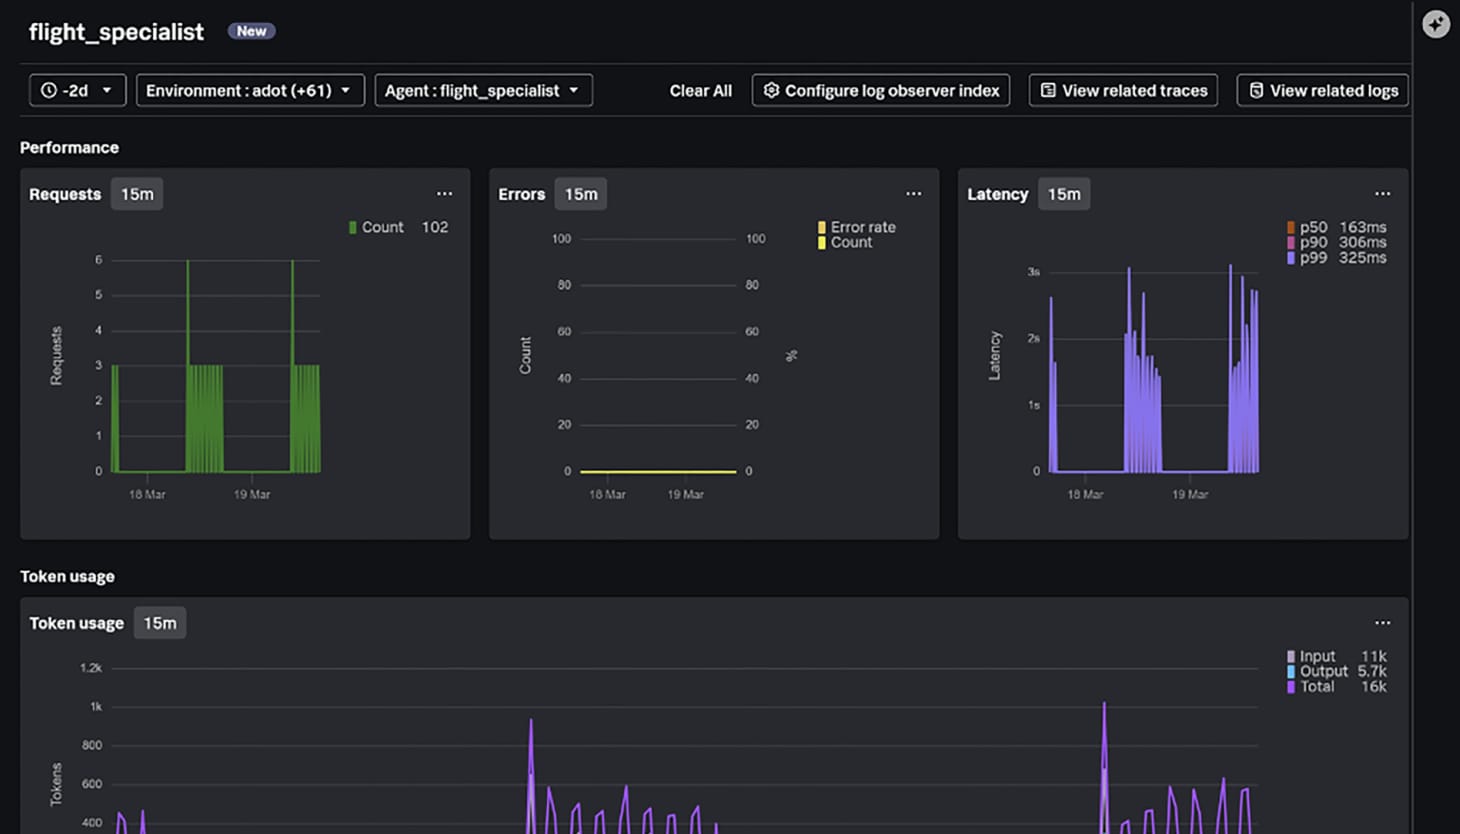
Trace failures to their root cause
See the tool calls, models, and retrieval steps of a workflow from request to response, then correlate that behavior with the infrastructure it ran on, so you get the root cause on one timeline.
Guardrails
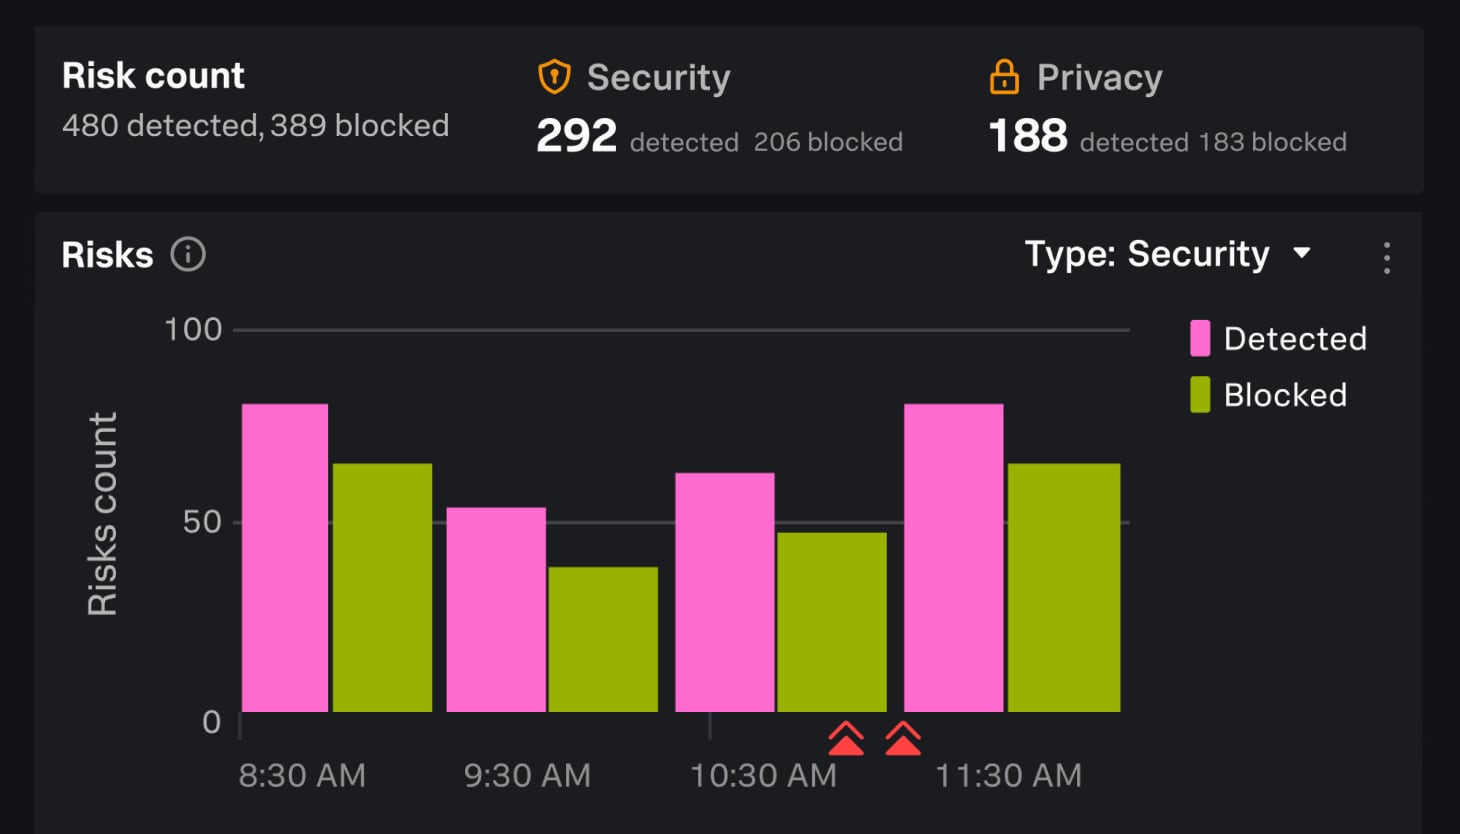
Stop risky action before execution
Turn the evaluations you trust into runtime guardrails for PII, PHI, and PCI leakage, tool misuse, and prompt injection, enforced in real time, not flagged after the fact.








Agent Observability FAQs
Splunk Agent Observability is a platform for making AI agents reliable in production. It brings together evaluation, observability, tokenomics, and guardrails so you can prove your agents are right, see what they do down to the GPU, know what they cost, and block the actions they shouldn't take.
It evaluates agent behavior against quality, safety, and security metrics, traces every step of a workflow from request to response and correlates it with the infrastructure underneath, tracks token cost by agent and workflow, and turns the evaluations you trust into runtime guardrails that block or steer risky actions.
It shortens root-cause analysis from days to minutes, catches quality and safety issues like hallucinations and PII leakage before they reach customers, ties AI cost to the value it delivers, and enforces guardrails in real time rather than flagging problems after the fact.
General-purpose monitoring sees infrastructure but not the agent's reasoning or output quality. Pure-play AI tools see prompts and scores but never the chip. Splunk spans the full stack, so a bad answer and the infrastructure that caused it appear in one place.
Evaluations and guardrails run on purpose-built small language models called Luna instead of frontier models, which makes it economically viable to score and protect 100% of production traffic rather than a small sample.
Related capabilities
Splunk Application Performance Monitoring
Full-fidelity tracing and always-on profiling to enhance app performance.
Splunk Infrastructure Monitoring
Real-time monitoring of cloud, hybrid, and on-prem environments.