
splunk background

visibility

See the complete agent trace

Trace agents from reasoning to the underlying GPU to quickly identify the root cause when issues arise.

Free edition Try it free for 14 days — no credit card required.
Take a guided tour Got 5 minutes? See how it works.
Visibility

Find the cause below the application layer

Follow a bad answer or a dead run all the way down to the chip that produced it, with the agent trace and the hardware event on one timeline.

Catch failures that start below the code

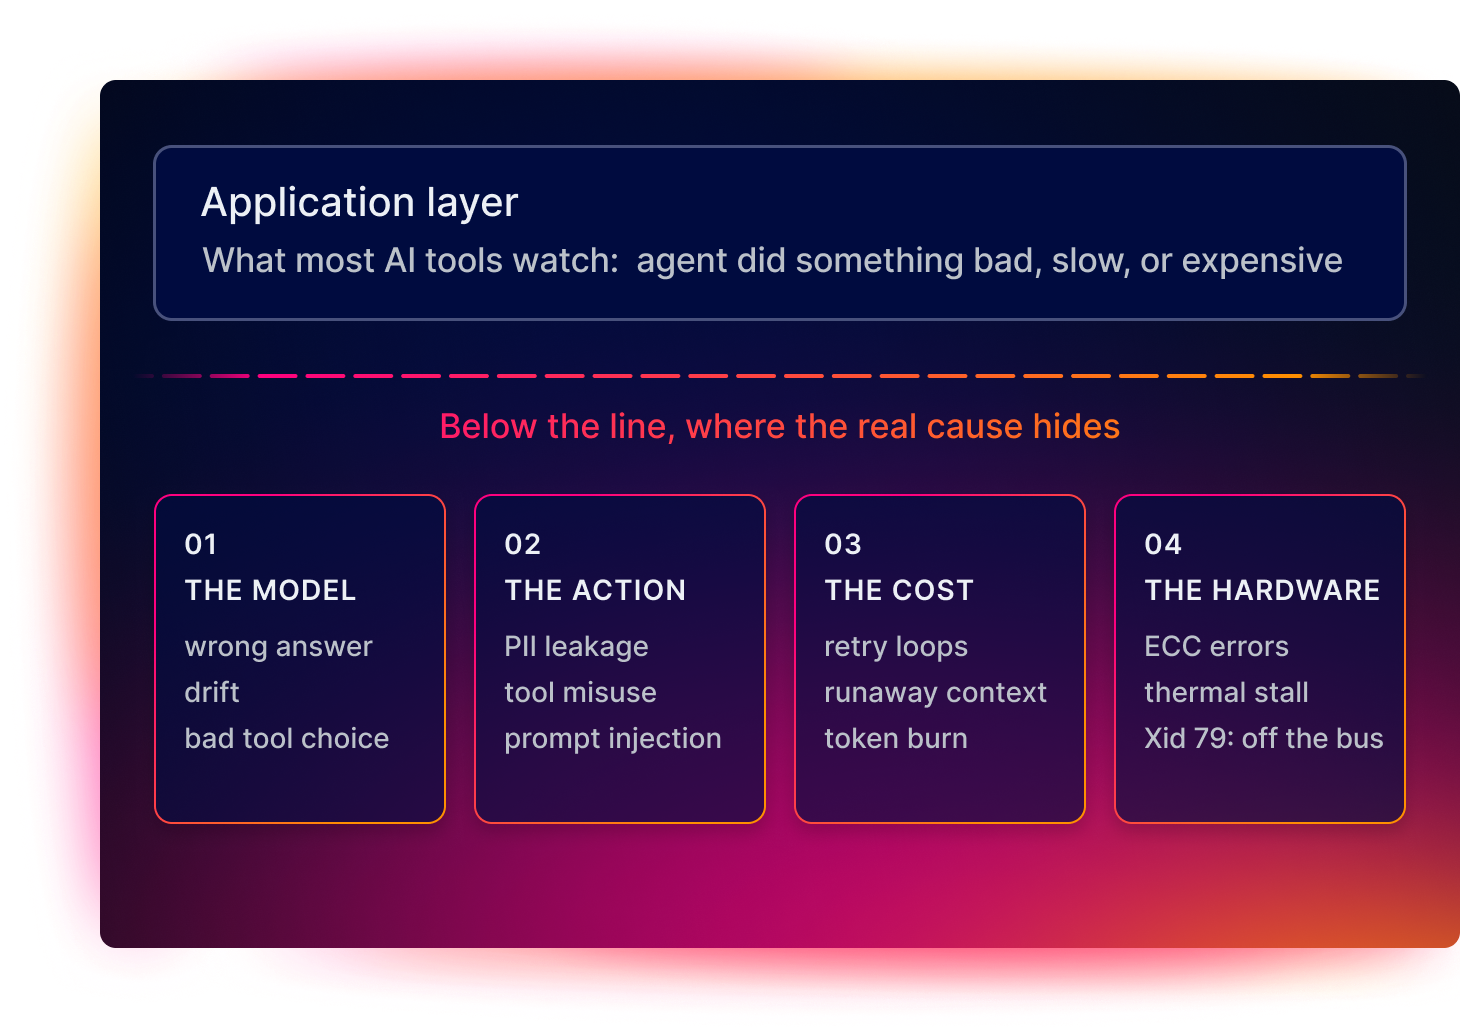
The root cause often hides behind the orchestration layer: the model hallucinated, the agent used a tool it shouldn't, the infrastructure quietly ran up the bill, or the hardware buckled.

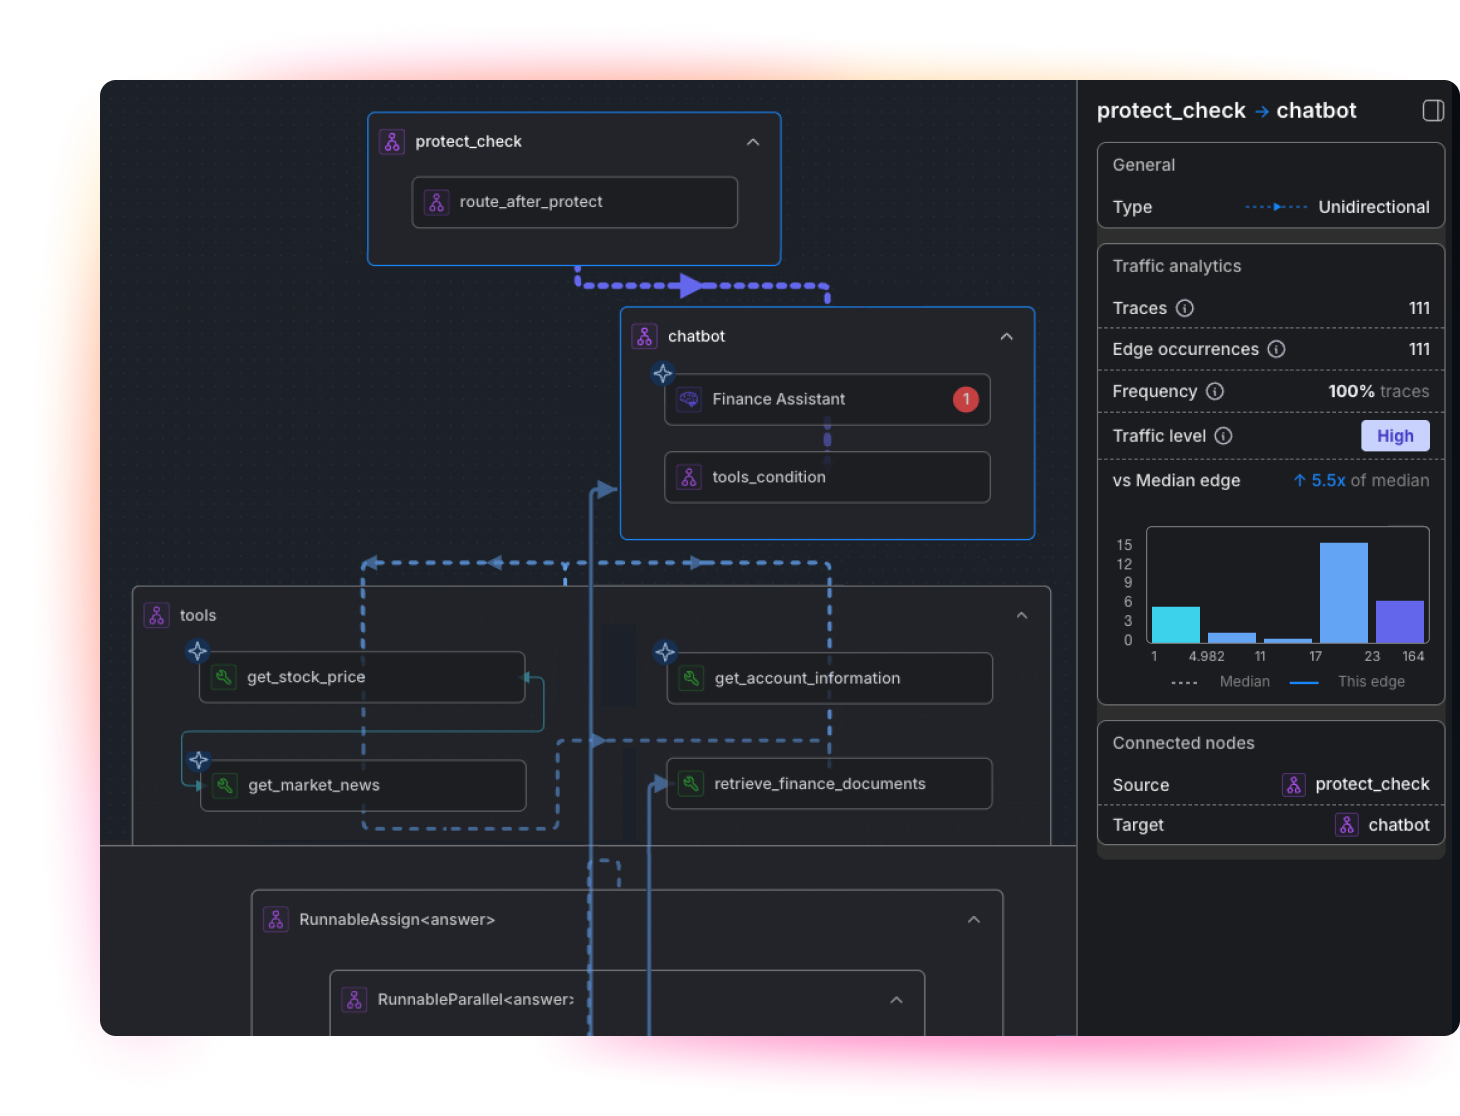
Trace and map a multi-agent workflow, from request to response

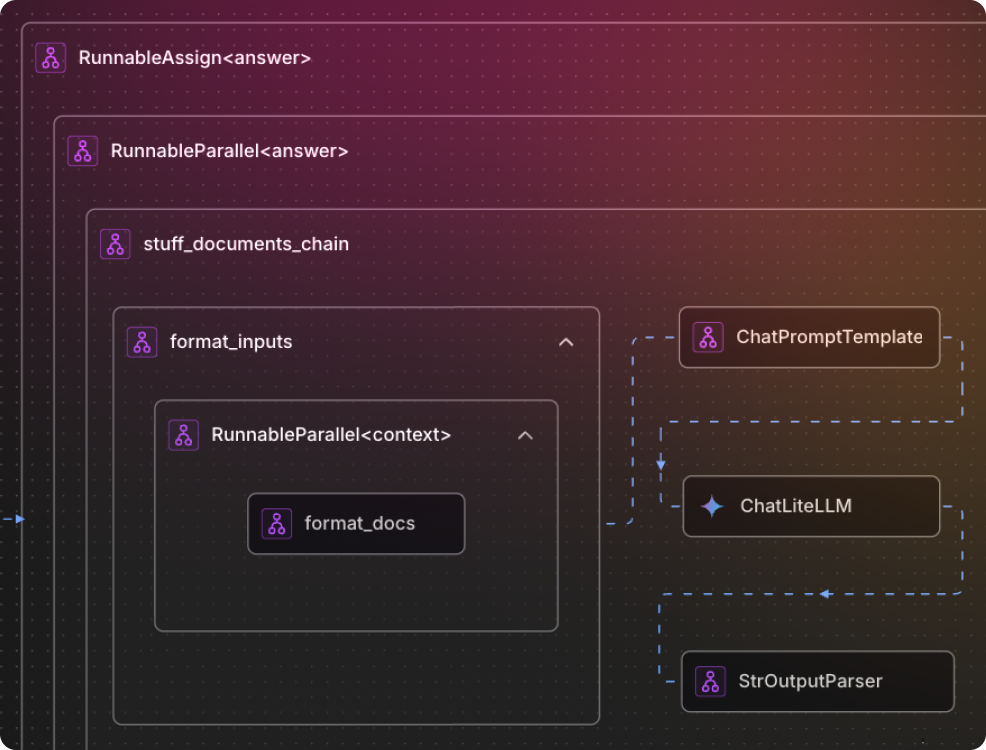
Follow one request from end to end. See how agents hand off work, where steps slow down, and where things go wrong. A trace shows an agent's reasoning, so you can read what it did and why, not just that it failed.

Correlate the agent and infrastructure on one timeline

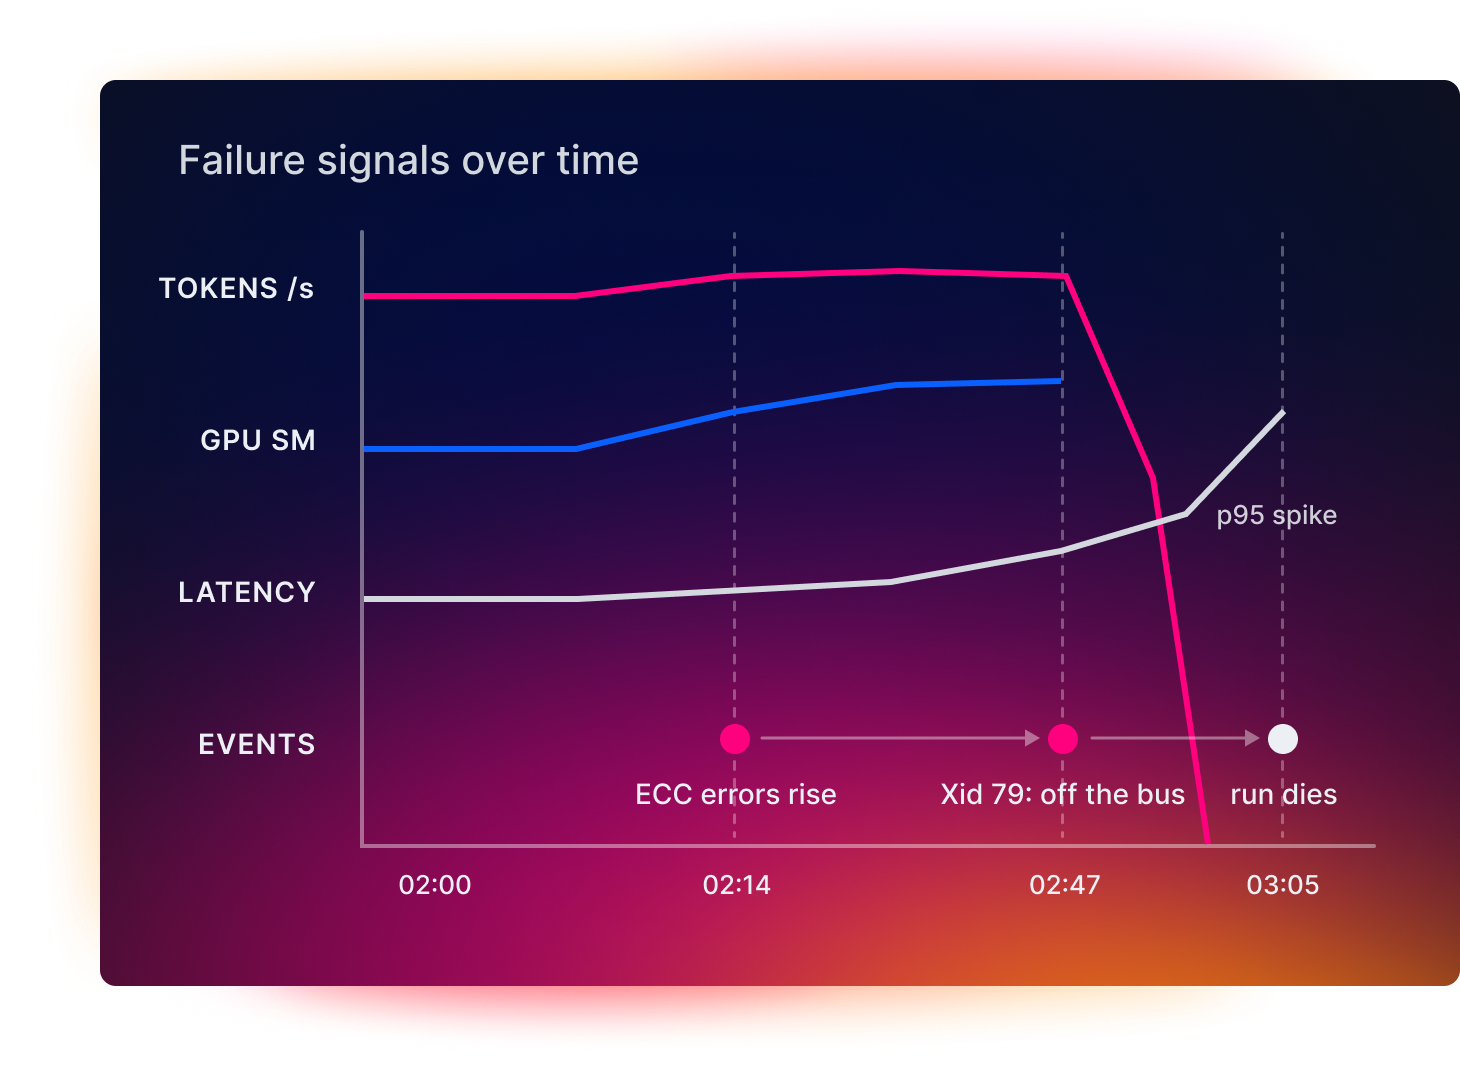
Correlated telemetry helps you visualize early signals of performance issues. When a token surge, saturated GPU, latency spike, rising ECC errors, and Xid 79 event appear together, teams can identify risk sooner, troubleshoot faster, and act before the run dies.

.Conf 26 promo image

Get hands-on with Splunk

Join us September 14–17 in Denver, CO for an immersive learning and networking event.

Register for .conf26

features

See the whole stack, from reasoning to the GPU
Explore the documentation
Trace one agent from reasoning to GPU Trace one agent from reasoning to GPU

Trace one agent from reasoning to GPU

ee the tool calls, models, and retrieval steps of a workflow from request to response, then connect that behavior to the infrastructure it ran on. Root cause shows up on one timeline, not in four disconnected tools.

spending spending

See the infrastructure underneath

Track GPU and memory use, power, and time-to-first-token across models, vector databases, and the rest of the AI stack. When a token surge meets a saturated GPU, the slow response stops being a mystery.

Read a failed run step by step Read a failed run step by step

Read a failed run step by step

Walk a single timeline from an ECC spike to a thermal or power anomaly, to Xid 79 and a dead run, with the agent trace and the GPU telemetry side by side. The answer to "why did it fail?" lives in one view.

traffic traffic

See the cascade before the run fails

Catastrophic failures rarely arrive without warning. The early signals are visible, so correlated telemetry can warn you while there is still time to recover the run before it dies at hour 47.

Know what is healthy and what is at risk Know what is healthy and what is at risk

Know what is healthy and what is at risk

Watch availability and health across the AI stack so degradation surfaces early. Catch the rising ECC count or the saturating cache before it becomes a dead run at hour 47.

Built on Splunk, correlated with Cisco Built on Splunk, correlated with Cisco

Built on Splunk, correlated with Cisco

Pure-play AI tools see the prompt but never the chip. General-purpose monitoring sees the GPU but never the agent's reasoning or the network fabric. Splunk and Cisco span the full stack, so a bad answer and the silicon that caused it land in one place.



Resources
Explore more from Splunk

Agent Observability and Tracing FAQs

Tracing follows a single request end to end across a multi-agent workflow, capturing every tool call, model, and retrieval step along with the agent's reasoning, then connecting that behavior to the infrastructure it ran on.

The cause usually hides below the application layer, in one of four places: the model was wrong, the agent did something it shouldn't, it quietly cost a fortune, or the hardware buckled.

Yes. A token surge, a saturated GPU, and a latency spike can be placed on one timeline, so a slow or failed run points to its real cause instead of a symptom.

When you run open-weight models on your own hardware, there is no provider status page to check. Correlated telemetry lets you follow a failure down to the chip and catch early signals like rising ECC errors before a long run dies.

Splunk Agent Observability is built on the Splunk data platform and correlated with Cisco infrastructure, so the agent's reasoning trace, output quality, cost, and the underlying GPUs, vector databases, and network fabric all live in one system of record.

Related products

Splunk Cloud Platform

Unify data, context, and action across every domain.

Learn more

Splunk Enterprise Security

Unified threat detection, investigation, and response for the agentic SOC.

Learn more

Splunk IT Service Intelligence

Predict and prevent IT issues with AI-driven service monitoring.

Learn more
Get started with Splunk

Find the root cause, from reasoning to the GPU.

Request a demo
Explore free trials