Dive into more features
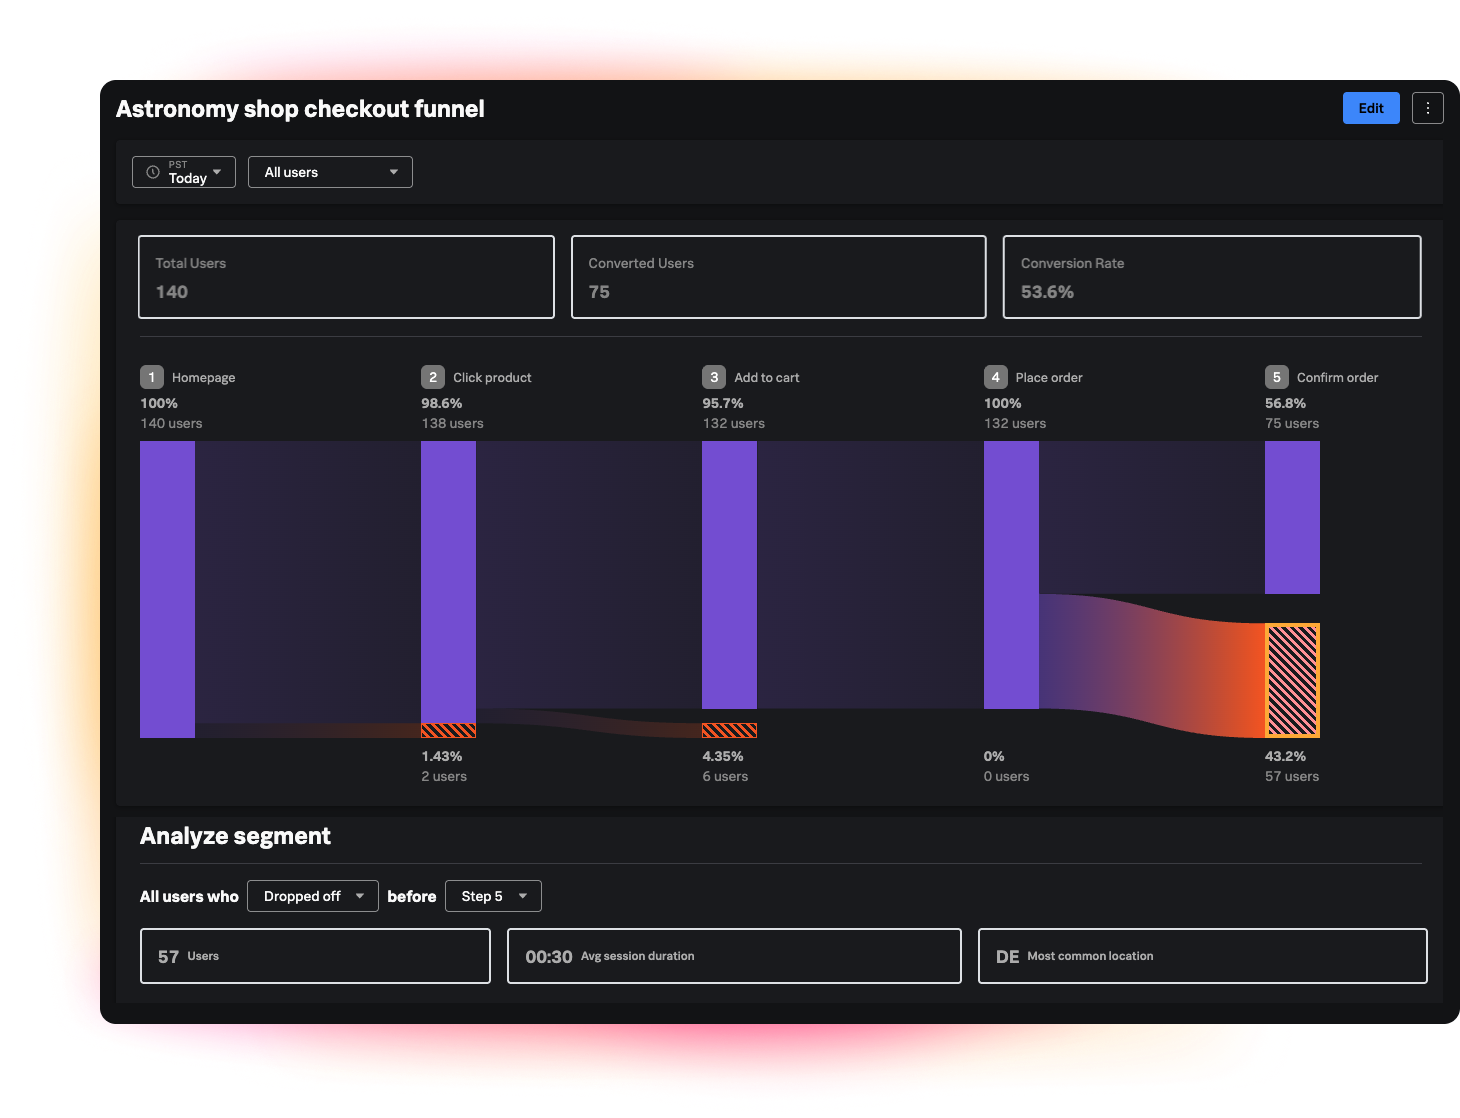
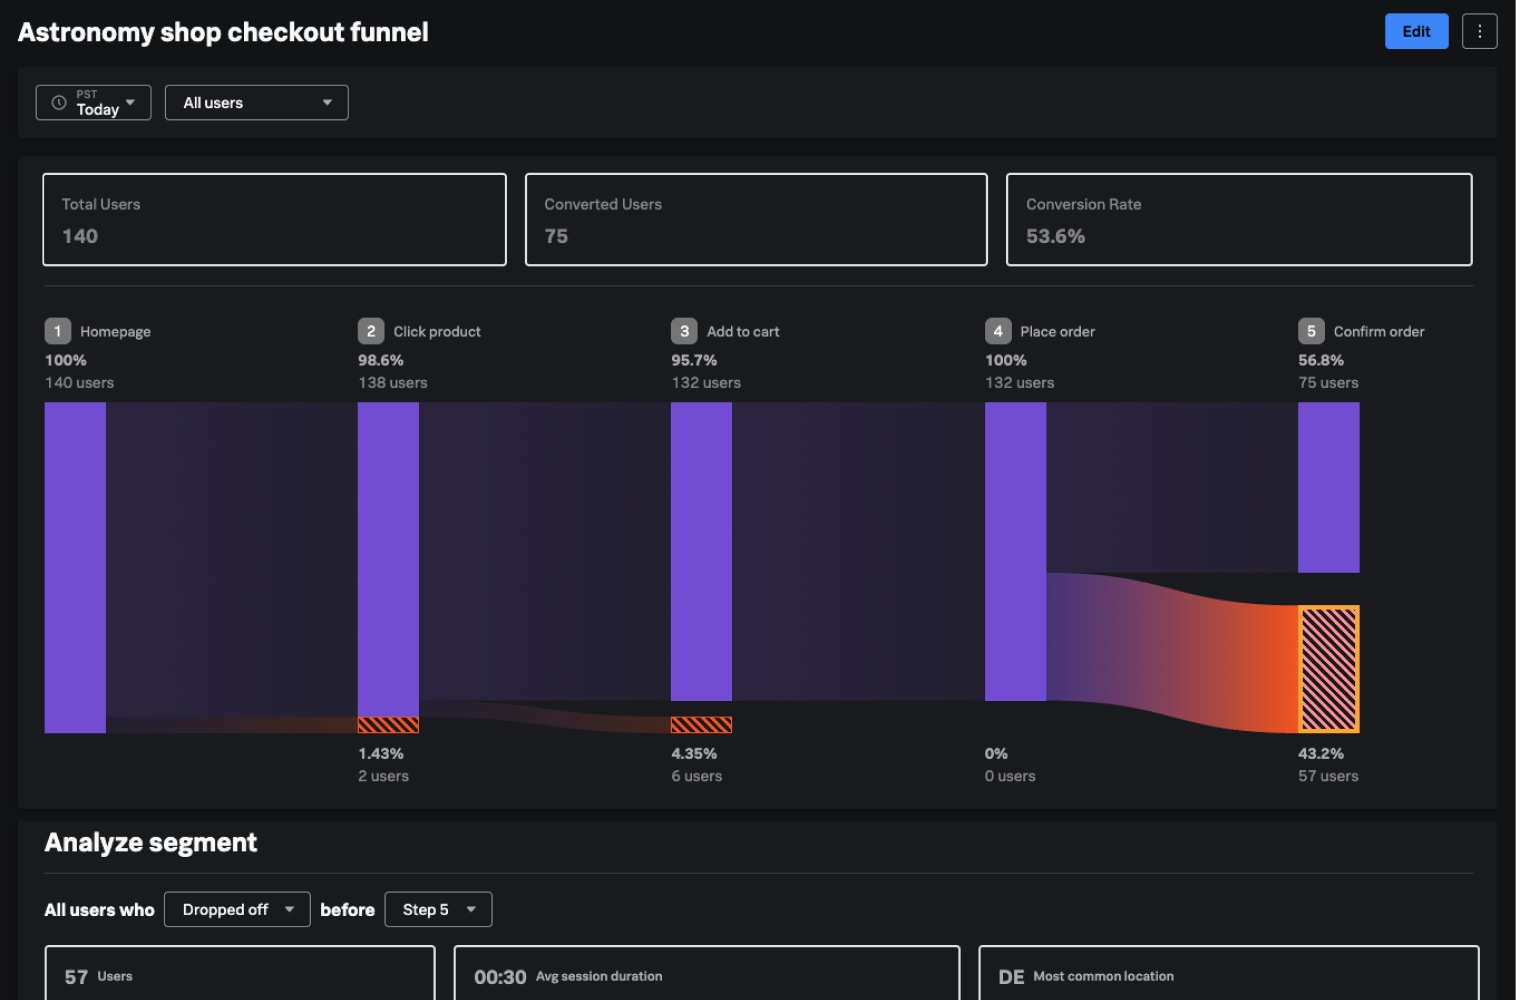
Conversion Funnels
Increase conversion rates for critical user journeys
Build multi-step funnels to define your desired “happy path” (for example, onboarding → activation → upgrade) and monitor conversion rates between each step. Data is retroactive.
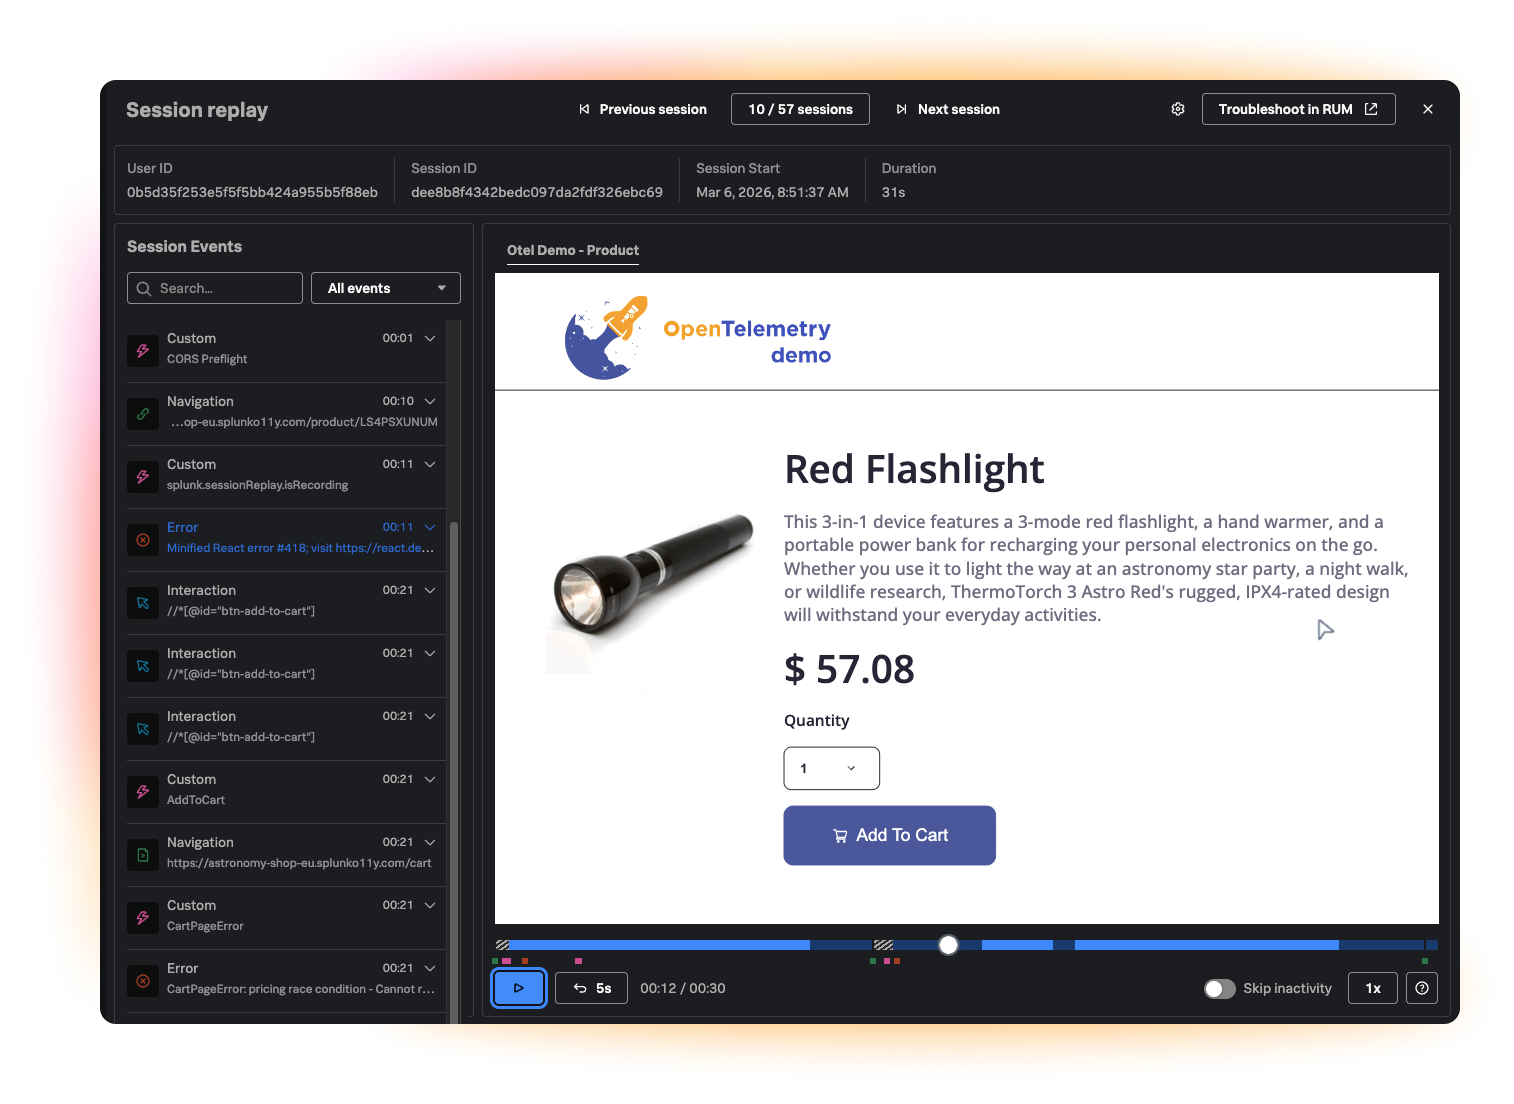
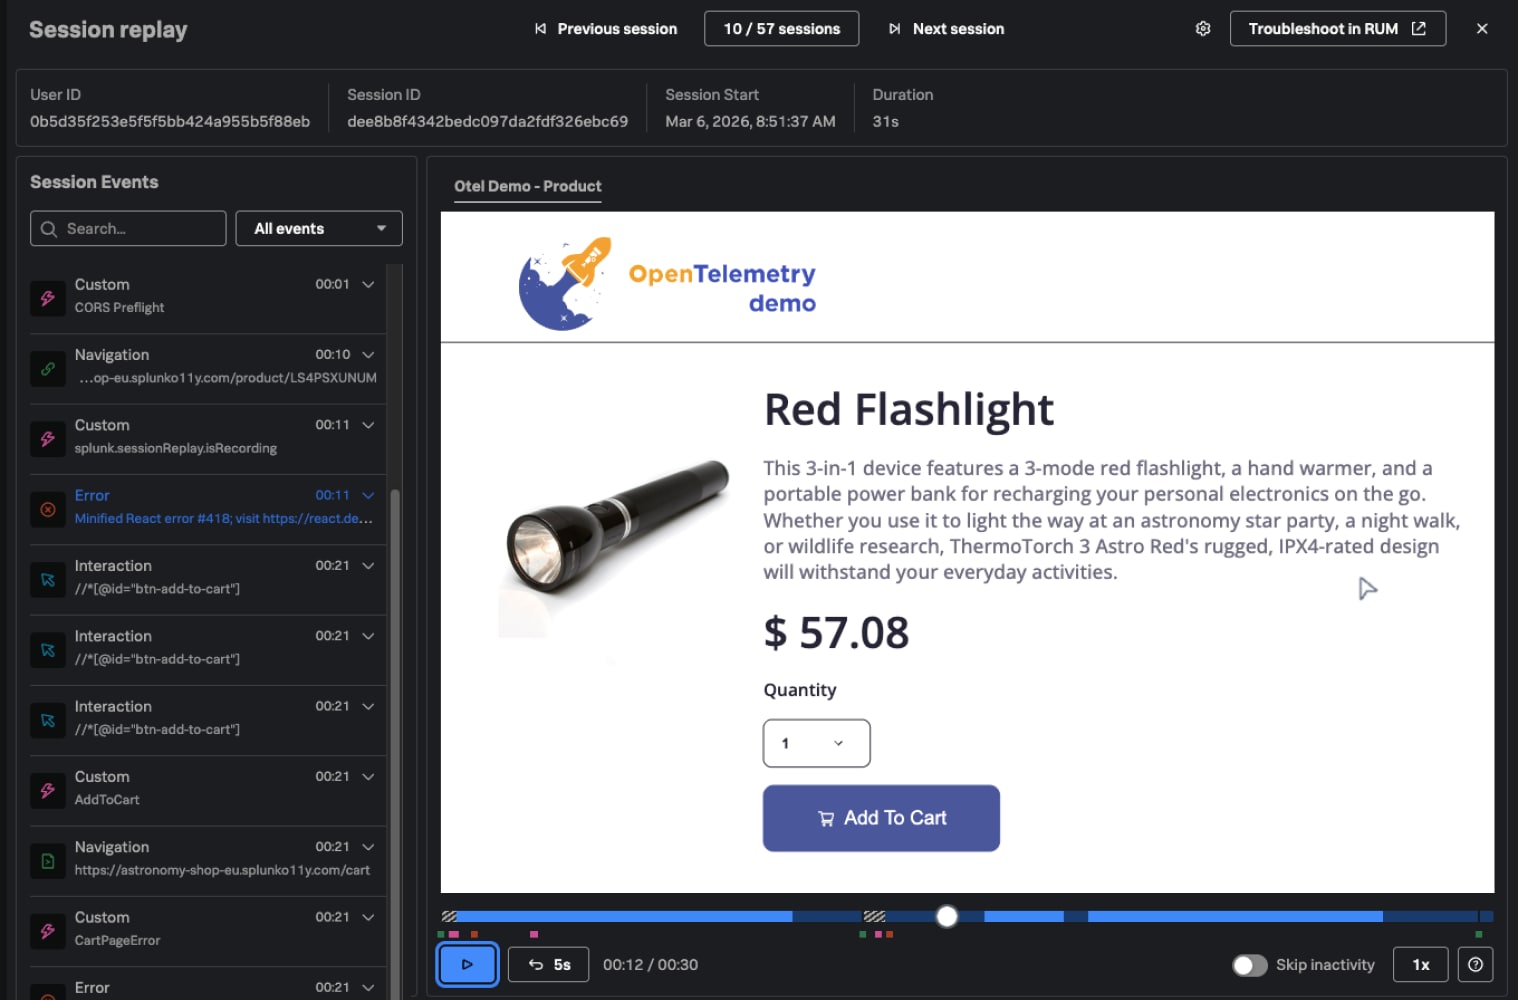
Session Replay
Record and visually reproduce user sessions to understand exactly what happened
When friction or funnel drop-offs occur, jump directly into a session replay from the user’s perspective at that exact moment to see what they clicked, scrolled, hesitated on, or abandoned.
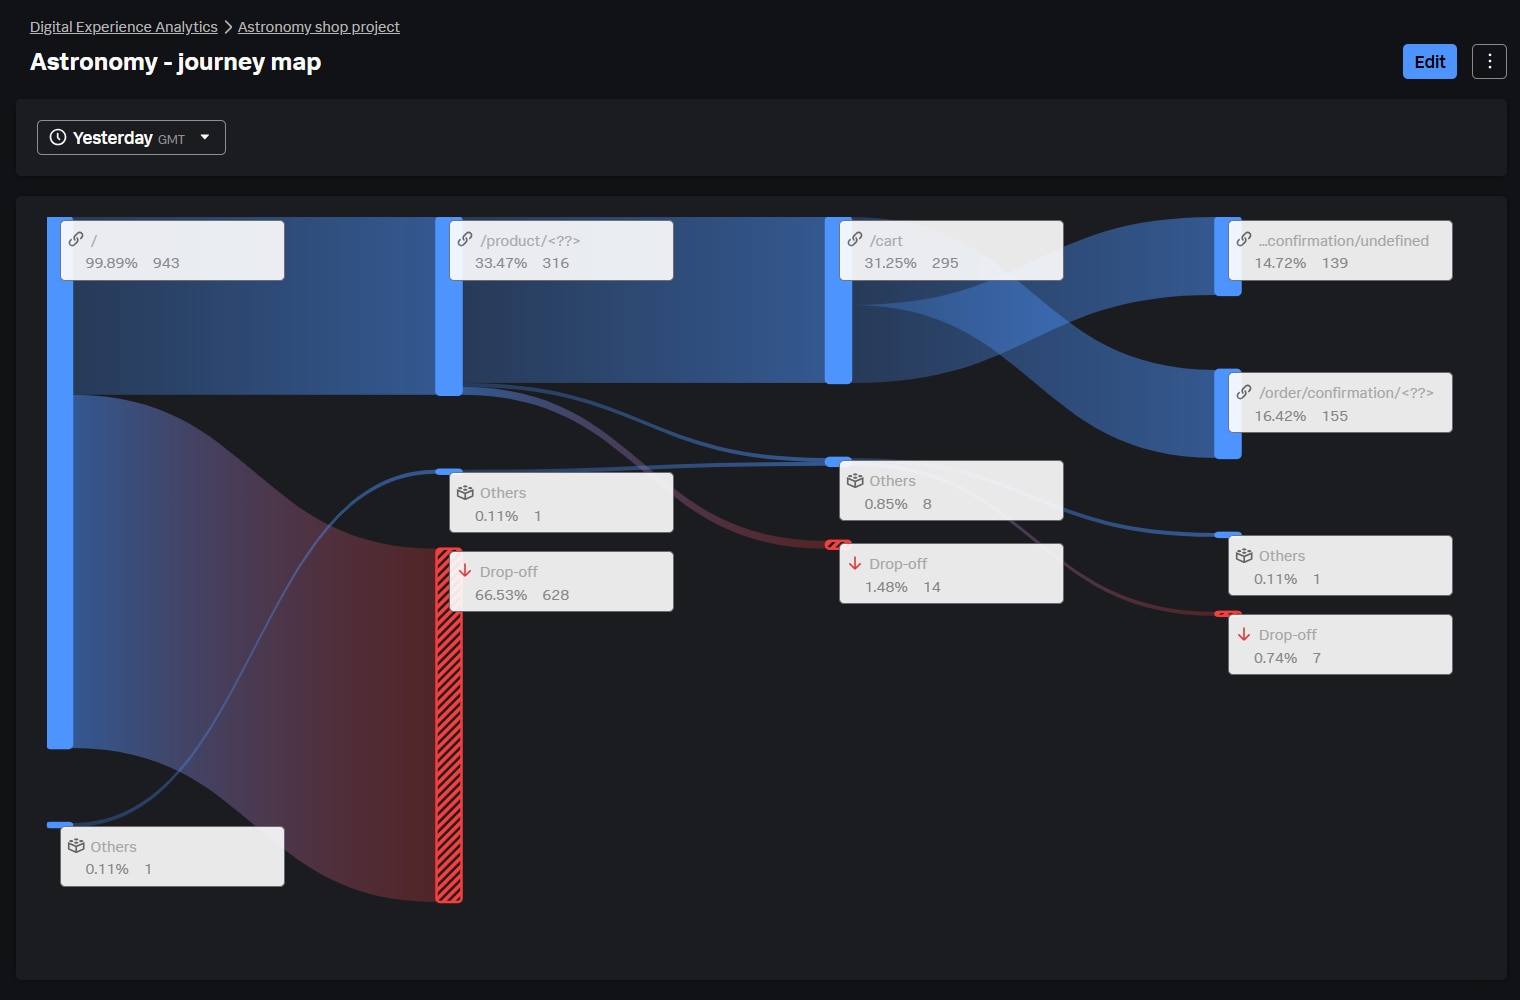
User Journey Maps
Analyze and map the most common user journeys
Gain insights into the most common paths users take within your app, including the paths leading to or following a specific event.
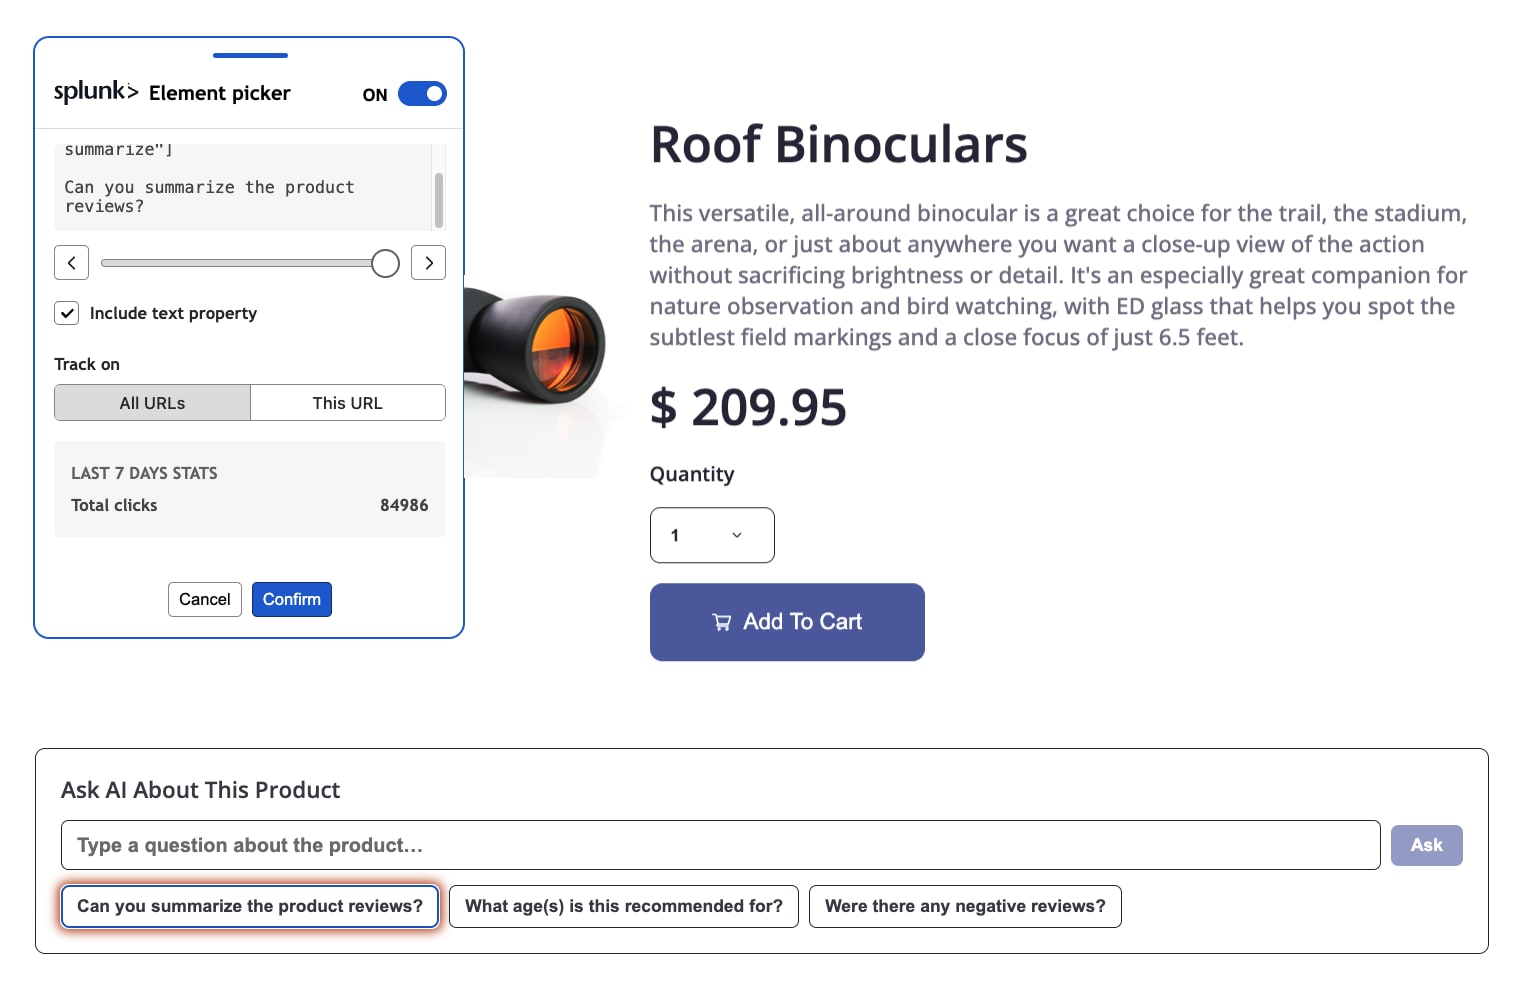
Event Analytics
Track and encourage the adoption of critical product features
Track all user actions, such as button clicks and page views, with time-series analysis to understand feature adoption. Create events directly from the UI using the element picker, without writing code.
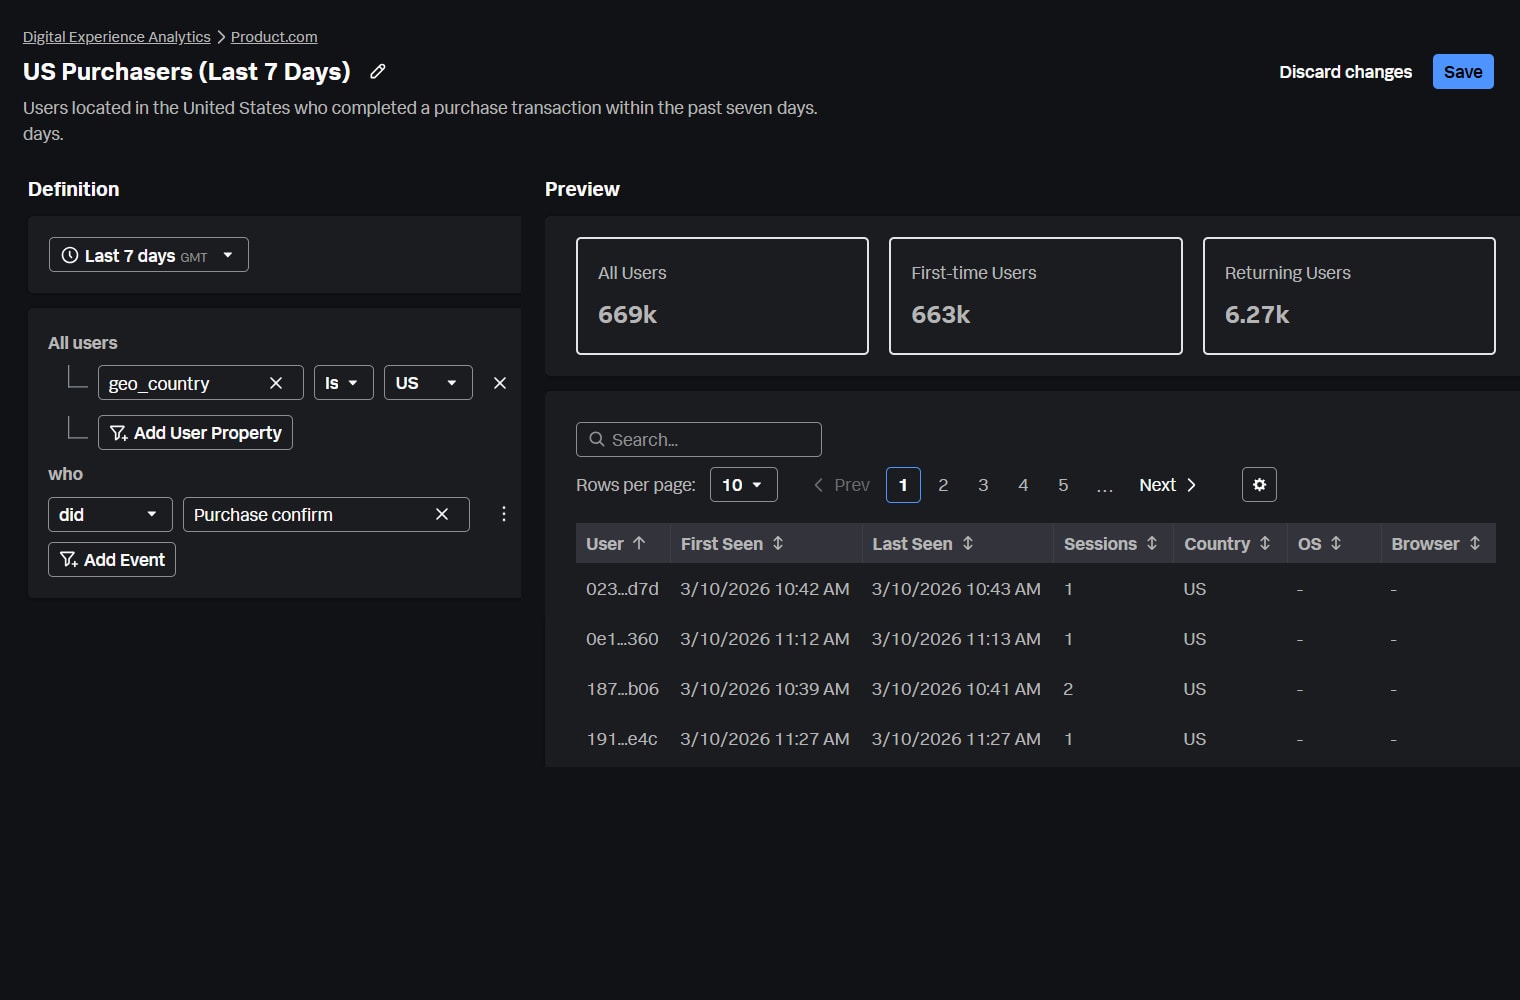
User Segments
Group users based on behavior or attributes to tailor strategies
Segment users by behavior (for example, first time vs. returning users) or attributes (such as country or browser) to compare experiences across cohorts and uncover opportunities for improvement. Apply segments consistently across Conversion Funnels, User Journey Maps, and Event Analytics.
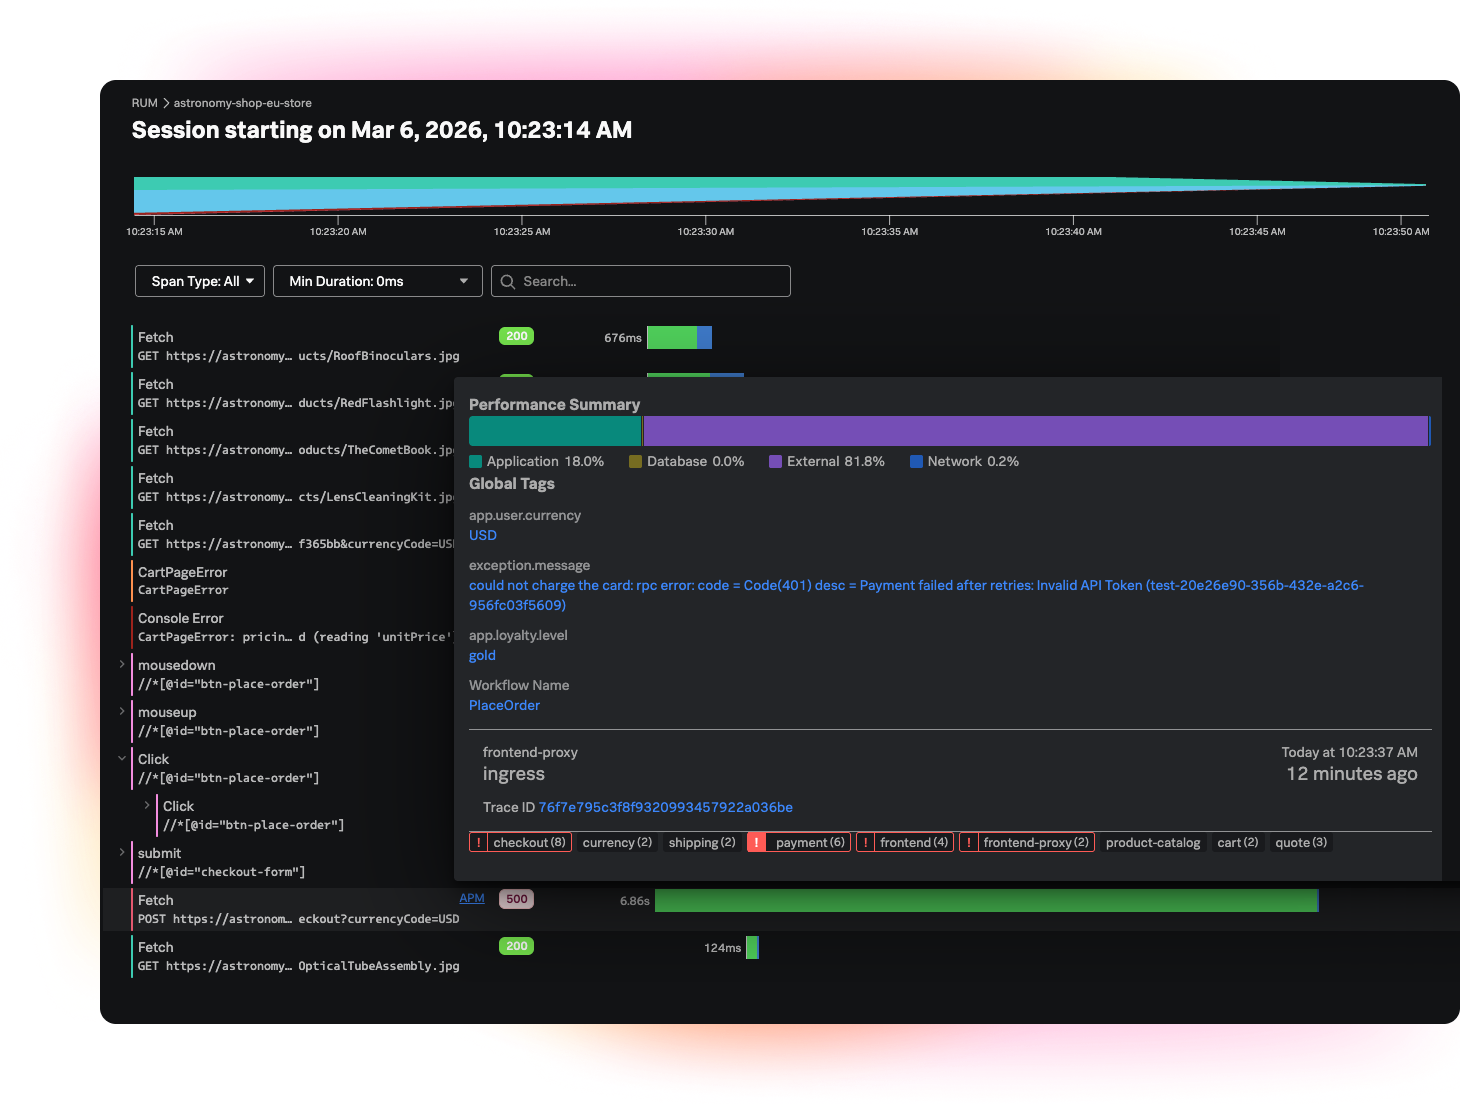
Friction Signals
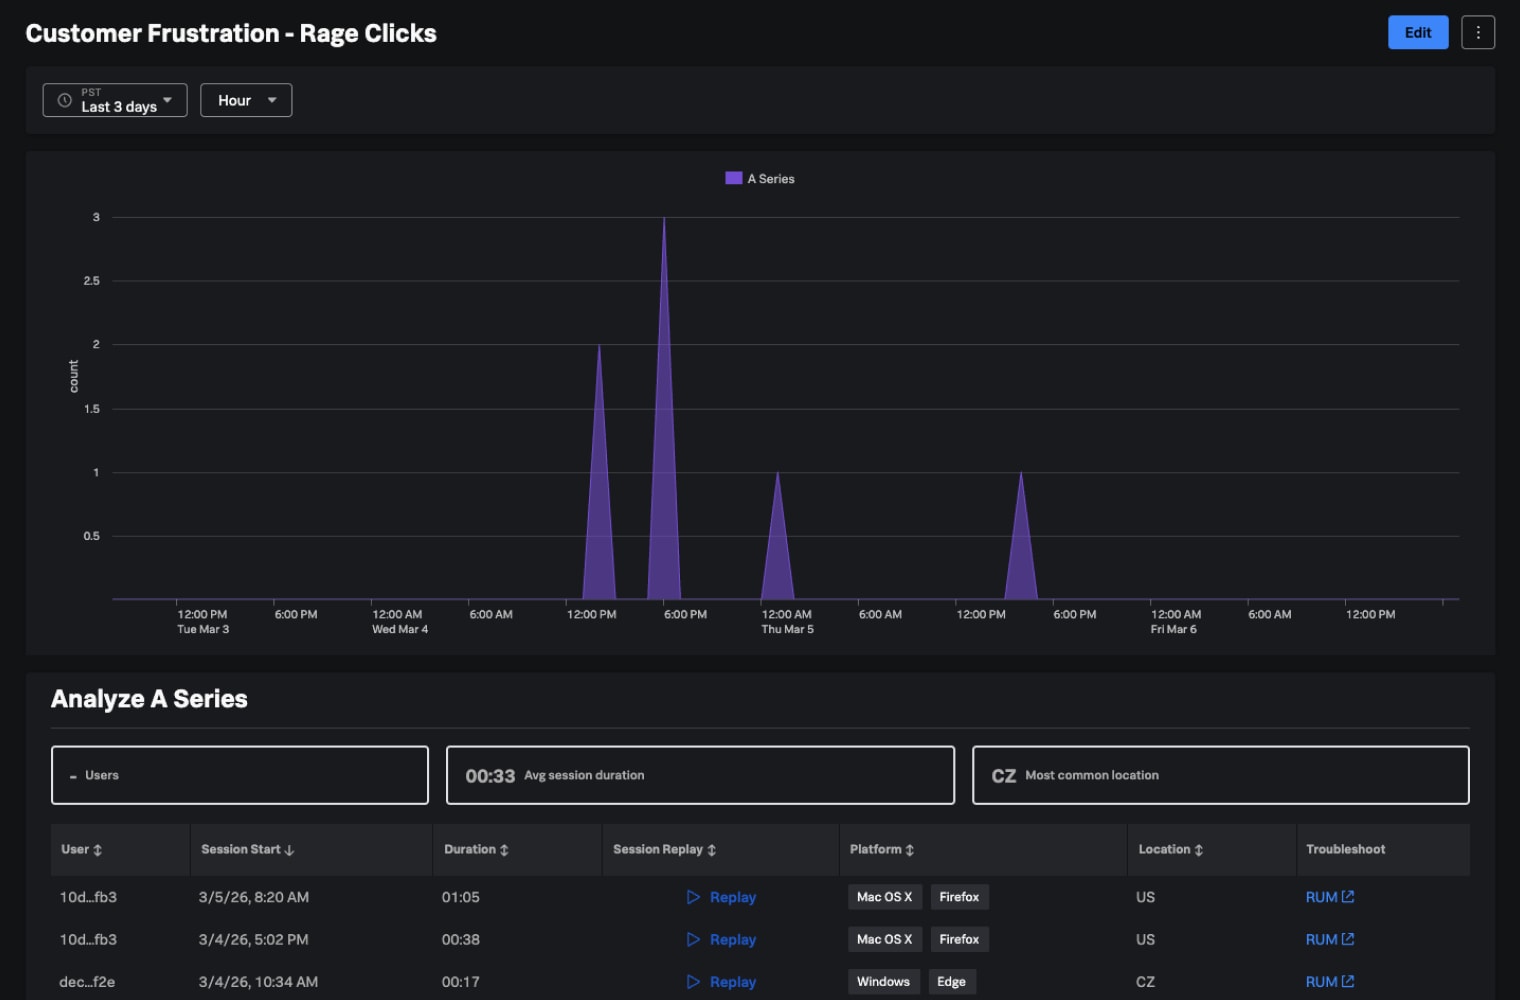
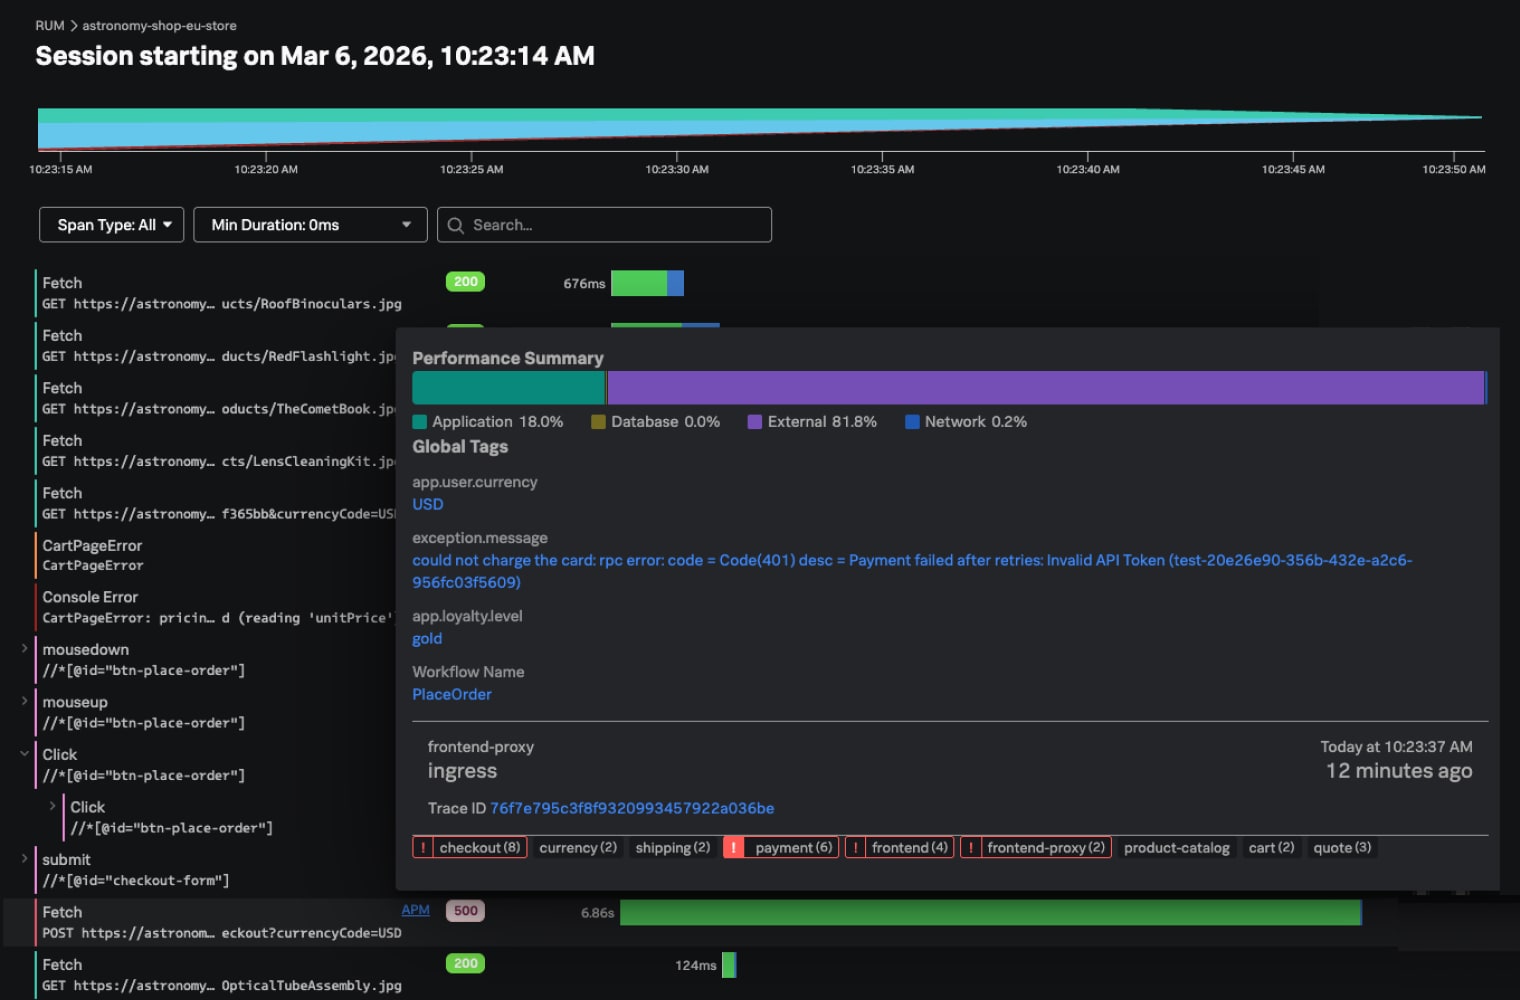
Out-of-the-box Correlation
Correlate Real User Monitoring and Digital Experience Analytics to prioritize smarter and troubleshoot faster
Correlate critical funnel drop-offs with underlying performance issues to prioritize engineering efforts and accelerate troubleshooting, for example, linking checkout abandonment to the code issue behind a slow “Place Order” button.