Splunk Steam for Real-Time Latte Analytics
Industries Matthias MaierAs my fellow coffee lovers may know, Monday 1st October was International Coffee Day - and what better way to honour it than with a blog post on Splunking my coffee machine? You see, I drink a lot coffee, so thought that a little self control wouldn’t hurt! Can you count how many cups you drink a day? Even the ones you mindlessly grab from the coffee machine because you’re so deep into your work - or is that just me?
Good For Monitoring Java Beans
Sure - I don’t have a super expensive, latest model coffee machine, with retina display, running on Linux connected via WiFi. I have an “analog” coffee machine. No ethernet cable or wireless, so thankfully I don’t need to patch and update firmware (sorry, I’m a security geek after all!). However, it still makes awesome coffee, and the best thing about it is the built-in mill, ensuring a fresh cup every time!
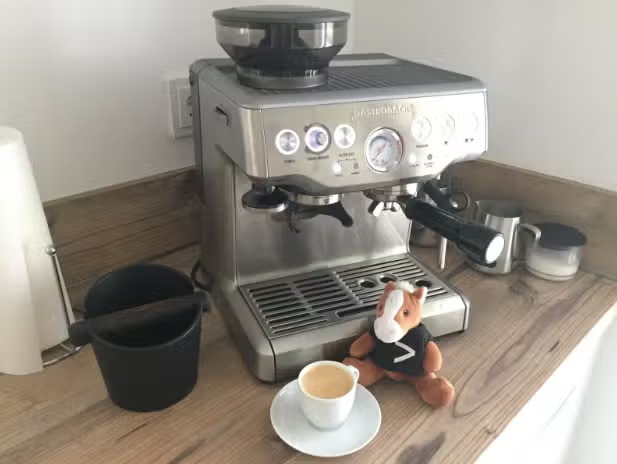
Good For Monitoring Java Beans - Adapter!
I invested 37 Euro and bought an Equip Wireless Plug from Edimax, which features an energy meter and connects to my WiFi.
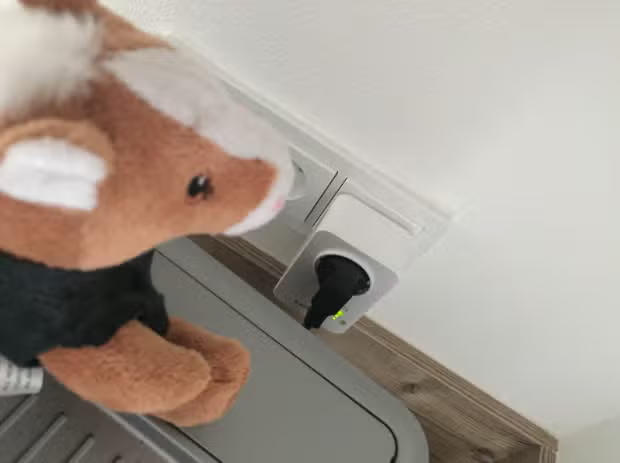
The decision for this particular adapter was due to someone’s review mentioning that it is possible to access and control the device via rest. Someone also posted handy script samples on github of how to do so.
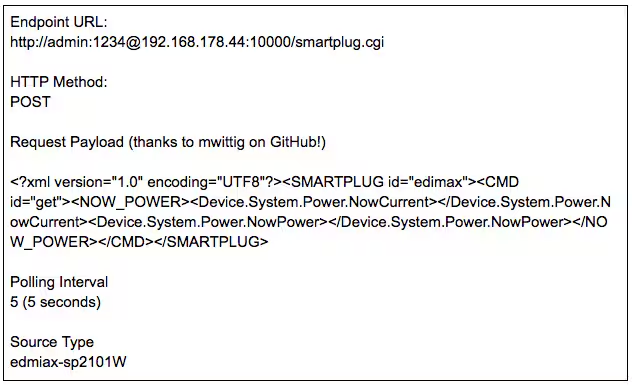
I installed this into my Splunk instance at home using the Rest API Modular Input app and configured a new input, immediately pulling in events every five seconds, as instructed:
I think the same scenario of analog devices is often present in the Industry 4.0 arena - there are old machines that work, but you still need to get some “insight” out of them.
E-vente Analytics
Ok, the data is not strictly from my coffee machine, but from the power plug connected to it. Here’s the energy consumption parameter:

As you can see, I have extracted two value’s; Ampere and Watt. I retrieve those values now every five seconds - day and night!
MTTR - Mean Time To Ristretto
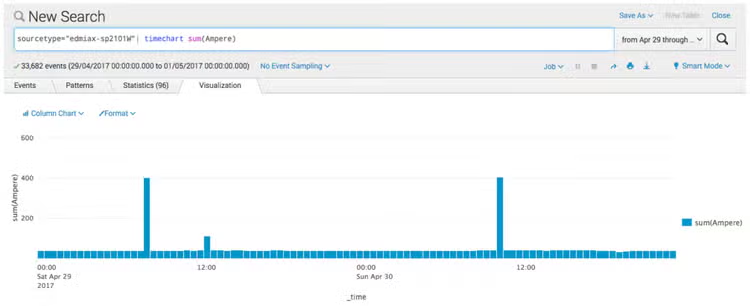
Next, I created a timechart and calculated the used Ampere, as there is a higher consumption if the machine is on and running. So you can see already a clear trend; five cups of coffee from the morning of May 2nd to lunch is a typical home office day. You can also see that on the next day I was apparently more alert, and reduced my coffee consumption.
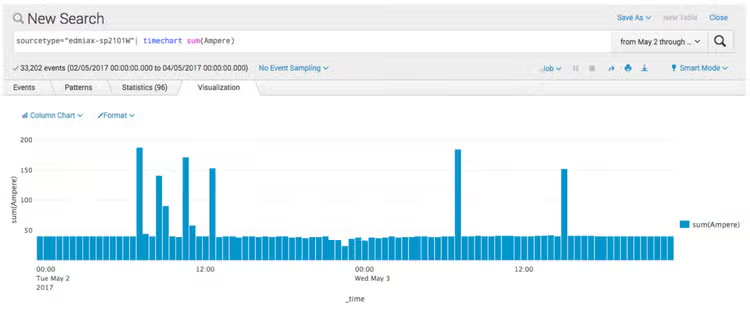
My weekend coffee habits look a little healthier. However, many argue that coffee is healthy - so I’ll let you be the judge! Notice that the Ampere here is up from 200 to 400? This is because alongside my daily espresso habits, my wife always has a cappuccino - but she gets her weekday fix in the office rather than at home.
From Zero To Nero Downtime
Now the fun really starts when we use Splunk to answer key questions, and find interesting correlations. Here are some examples of what we could ask:
- How many times is maintenance needed to descale my machine?
- What would be the best time to descale my coffee machine to ensure my drinking behaviour is not impacted?
- Can I identify how often the machine runs dry from lack of water (which is not healthy for the machine)?
- How many cappuccinos are made vs. espressos?
- What’s the cost-a of running my coffee machine?
Got any more ideas (or coffee-related puns?), let me know! Enjoy your coffee today - cheers and happy Splunking!
Matthias
Related Articles

Splunk Essentials for Financial Services Industry v1.1 Release

Splunk Partners with Internet2 to Make Solutions More Accessible for the Academic Research and Education Community