Get hands-on with Splunk
Join us September 14–17 in Denver, CO for an immersive learning and networking event.
/en_us/blog/leadership/splunk-cisco-live-agentic-operations
Featured Articles
displayMode
carousel
filter
paths
paths
/en_us/blog/conf-splunklive/top-5-reasons-to-attend-conf26-in-denver
/en_us/blog/platform/new-cloud-enabled-features-for-splunk-enterprise-customers-via-cloud-connect
/en_us/blog/platform/must-see-splunk-sessions-from-cisco-live-2026
/en_us/blog/industries/splunk-victoria-experience-is-now-authorized-at-fedramp-high
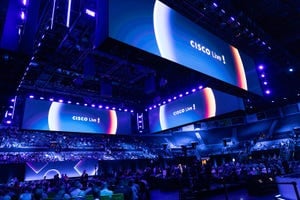
Watch Now: 10 Must-See Splunk Sessions from Cisco Live 2026 Las Vegas
The best sessions from Cisco Live 2026 Las Vegas are now available on-demand.


Splunk Blogs
Artificial Intelligence
displayMode
carousel
filter
paths
paths

Introducing Splunk Agent Launchpad: Turn Operational Signals Into Agent-Powered Action
Announcing the general availability of Splunk Agent Launchpad, a no-code way of building agents within your Splunk environment with your RBAC.


Learn
displayMode
carousel
filter
paths
paths
/en_us/blog/learn/siem-security-information-event-management
/en_us/blog/learn/it-tech-spending
/en_us/blog/learn/small-language-models-slms
/en_us/blog/learn/what-is-telemetry
/en_us/blog/learn/cloud-service-models-saas-vs-paas-vs-iaas
/en_us/blog/learn/observability

What Are SLMs? Small Language Models, Explained
Large language models have changed the world. What about small language models? Learn what SLMs are, how they differ from LLMs, and why SLMs are the future.