It’s cold outside – A year’s worth of data from my pellet heating unit!
Tips & Tricks Matthias MaierHello,
Over a year ago I shared a blog about my efforts to monitor the pellet unit I use for heating my home. I wanted to share a report on how it went with access to a year’s worth of data and what new tuning steps I have added as a result. Remember – I’m an IT guy – not a pellet home heating system expert – but as I spoke to the experts they got really excited about what I found and how I could fine tune everything – so I thought I would share it with you so that you too can mess up the configuration of your home heater as well ;-).
A year’s worth of data
First of all – in December and January, which are obviously cold months in Germany, I monitored pellet consumption closely with Splunk. My pellet unit does not have any built in analytics and reporting functionalities but through a WebAPI I was able to collect the data. All the dashboards, searches and data inputs I used for this project have been packaged together and shared in Splunkbase as an App.
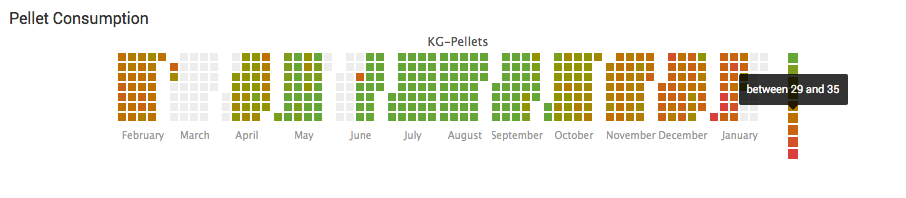
You can clearly see the pellet consumption for the full year. The redder the squares – the more pellets a day were consumed.
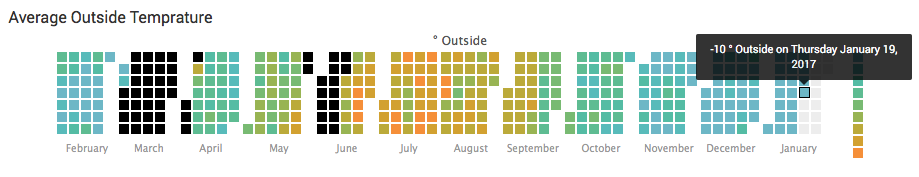
As the heating unit also has an outside temperature sensor to increase the heating capacity on cold days and lower on warm days I have been able to show the average temperature for all days. I have to add that my Splunk Server had an issue in March and towards the end of June I also had some water from heavy rain in my basement.
Throughout the course of the year the warm water solar system on top of my house helped provide additional warmth when the sun shined.
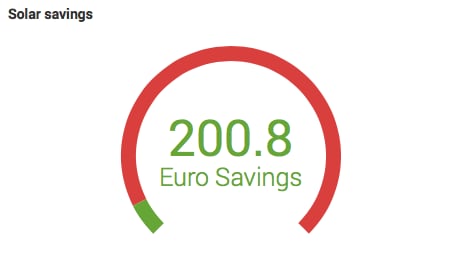
Through this I saved 200.80 Euros over the course of the year. I spent about 3,000 Euros on the system – so you can see on the green/red range that we are going to need some additional sunny years to pay it of!
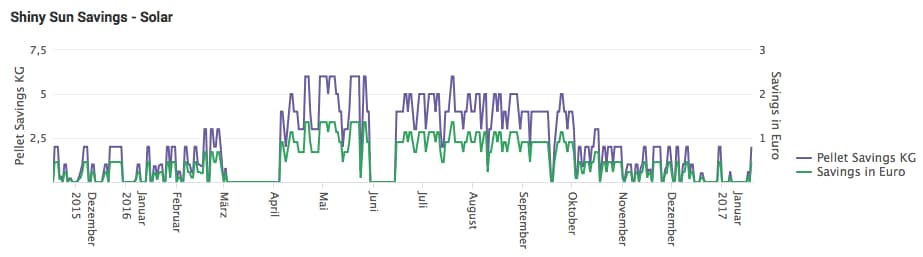
Here’s how the savings from the solar panels look over the course of the year in terms of reduced pellet consumption in KGs as well as Euros. As you can see the summer is when this happened the most – November was foggy, December 2016 was reasonably sunny but since the end of that month you can see the current weather report…
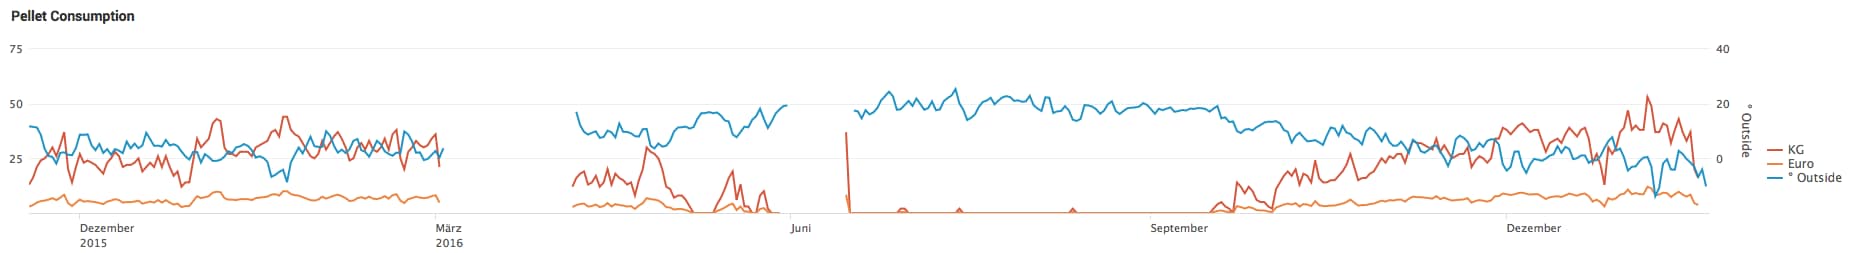
Here you can review the annual trend of pellet consumption correlated with outside temperature. This is the one I used most when comparing the new settings I configured in my heating system to see how it affected pellet consumption.
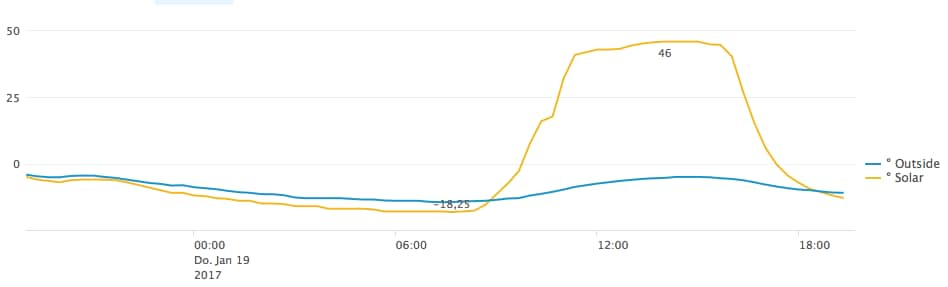
This graph is also really cool as it shows a day when we had an outside temperature in the morning of -18 degrees and during the day around of -12. Yet thanks to the sunny weather the solar panels helped with the heating and pushed the temperature up to 46 degrees for almost the entire day. As soon as the sun goes down you can see how quickly the solar panel falls from +46 degrees to -10.
Tuning the configuration to reduce consumption
I also noticed that even when it’s very cold outside and we decided to heat a few rooms and not the full house – we still needed a lot of pellets.

As you can see – on Friday 6th of January I needed a lot of pellets. I thought this couldn’t be right – I estimated about 20-30 KG Pellets per day on a cold day. I had the chimney sweeper come in at around the same time – and even he couldn’t help me. So I started to add some other data from the pellet systems to Splunk to monitor.
Specifically data from:
- Underfloor heating
- Radiators
- Buffer storage temperatures (Buffer storage is the hot water tank that stores the energy generated by the pellet burner)
- Status of pellet unit (heating, ready, starting to head, flame clean)
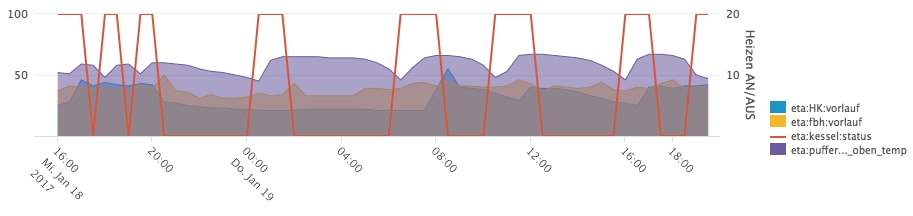
I thought that with these parameters I should be able to find out where and what the most pellets are used for. It looked like this:
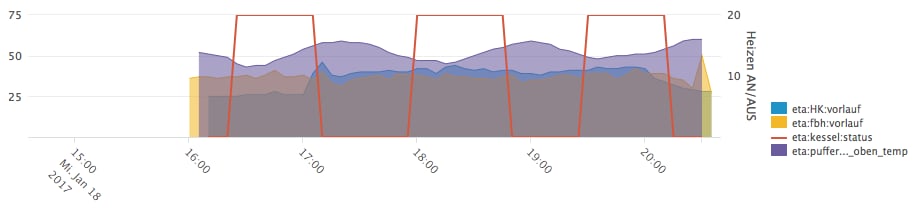
When the pellet machine was “heating up” I added the unit value of 20 for the graph. So on the red line you can see when the unit was heating, with the violet colour showing the temperature in the buffer storage . I saw that the pellet unit would start burning, heat up the buffer storage and then stop again. Then within less then an hour, the buffer storage would fall just 10 degrees and the pellet unit would start to heat up again.
So at the end of each cycle we are only adding 10 degrees of heat but of course with pellets there is just on or off. You can’t tell the pellet machine to produce less temperature when its burning and a few KGs of pellets will always be needed for a proper burn cycle – you can’t just burn 200 grams worth of pellet. It was clear that there were simply to many burn cycles within a short period of time.
So I knew something was wrong.
I played around with the settings and found out that the bottom sensor of the buffer storage was set to send a heat signal when it fell by 10 degrees – this is a configuration which makes sense in summer to consume as much as possible from the solar panels. It doesn’t however make sense in winter.
I made a configuration change to ensure that the sensor at the bottom of the heating buffer stops the heating up process when 50 degrees is reached so the buffer storage would be fully loaded each time.
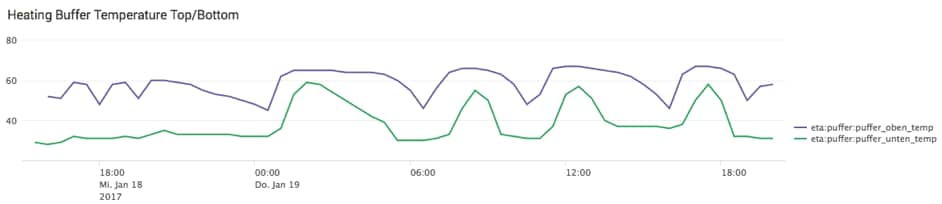
I could observe the problem at the beginning with a low temperature (green line) – and then after the configuration change we can see it fully loads at the top and bottom temperatures now.
What about the pellet consumption now?
As you can see – until 20:00 the misconfiguration with constant heating start/stop was occurring with the system heating up just a little every time. At about 20:30 I made the configuration changes and in the next day you can see the heating storage can be utilised for far longer with fewer but more intensive heating cycles.
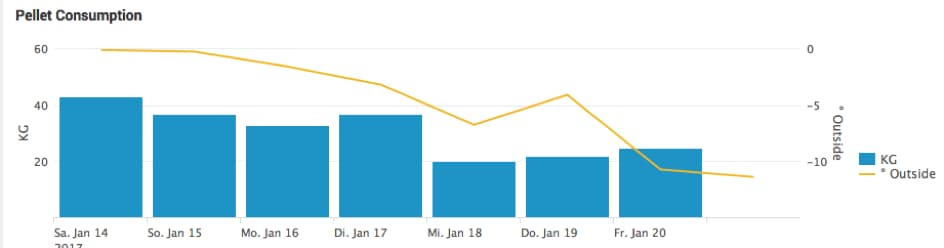
You can see that in the days before this change occurred more pellets were burned then in the most recent days – even if it became very cold with an average temperature of -10 degrees! It seems clear that the pellet unit needs a certain amount of pellet per burn to be effective, it doesn’t matter if you are heating up a little bit up or if you are heating up a lot.
I enjoy analyzing and understand how it all works, then optimizing and monitoring for improvements – especially as I can directly calculate savings – 1 KG pellet costs me 0.2268 Euro!
What will you Splunk next?
Enjoy,
Matthias
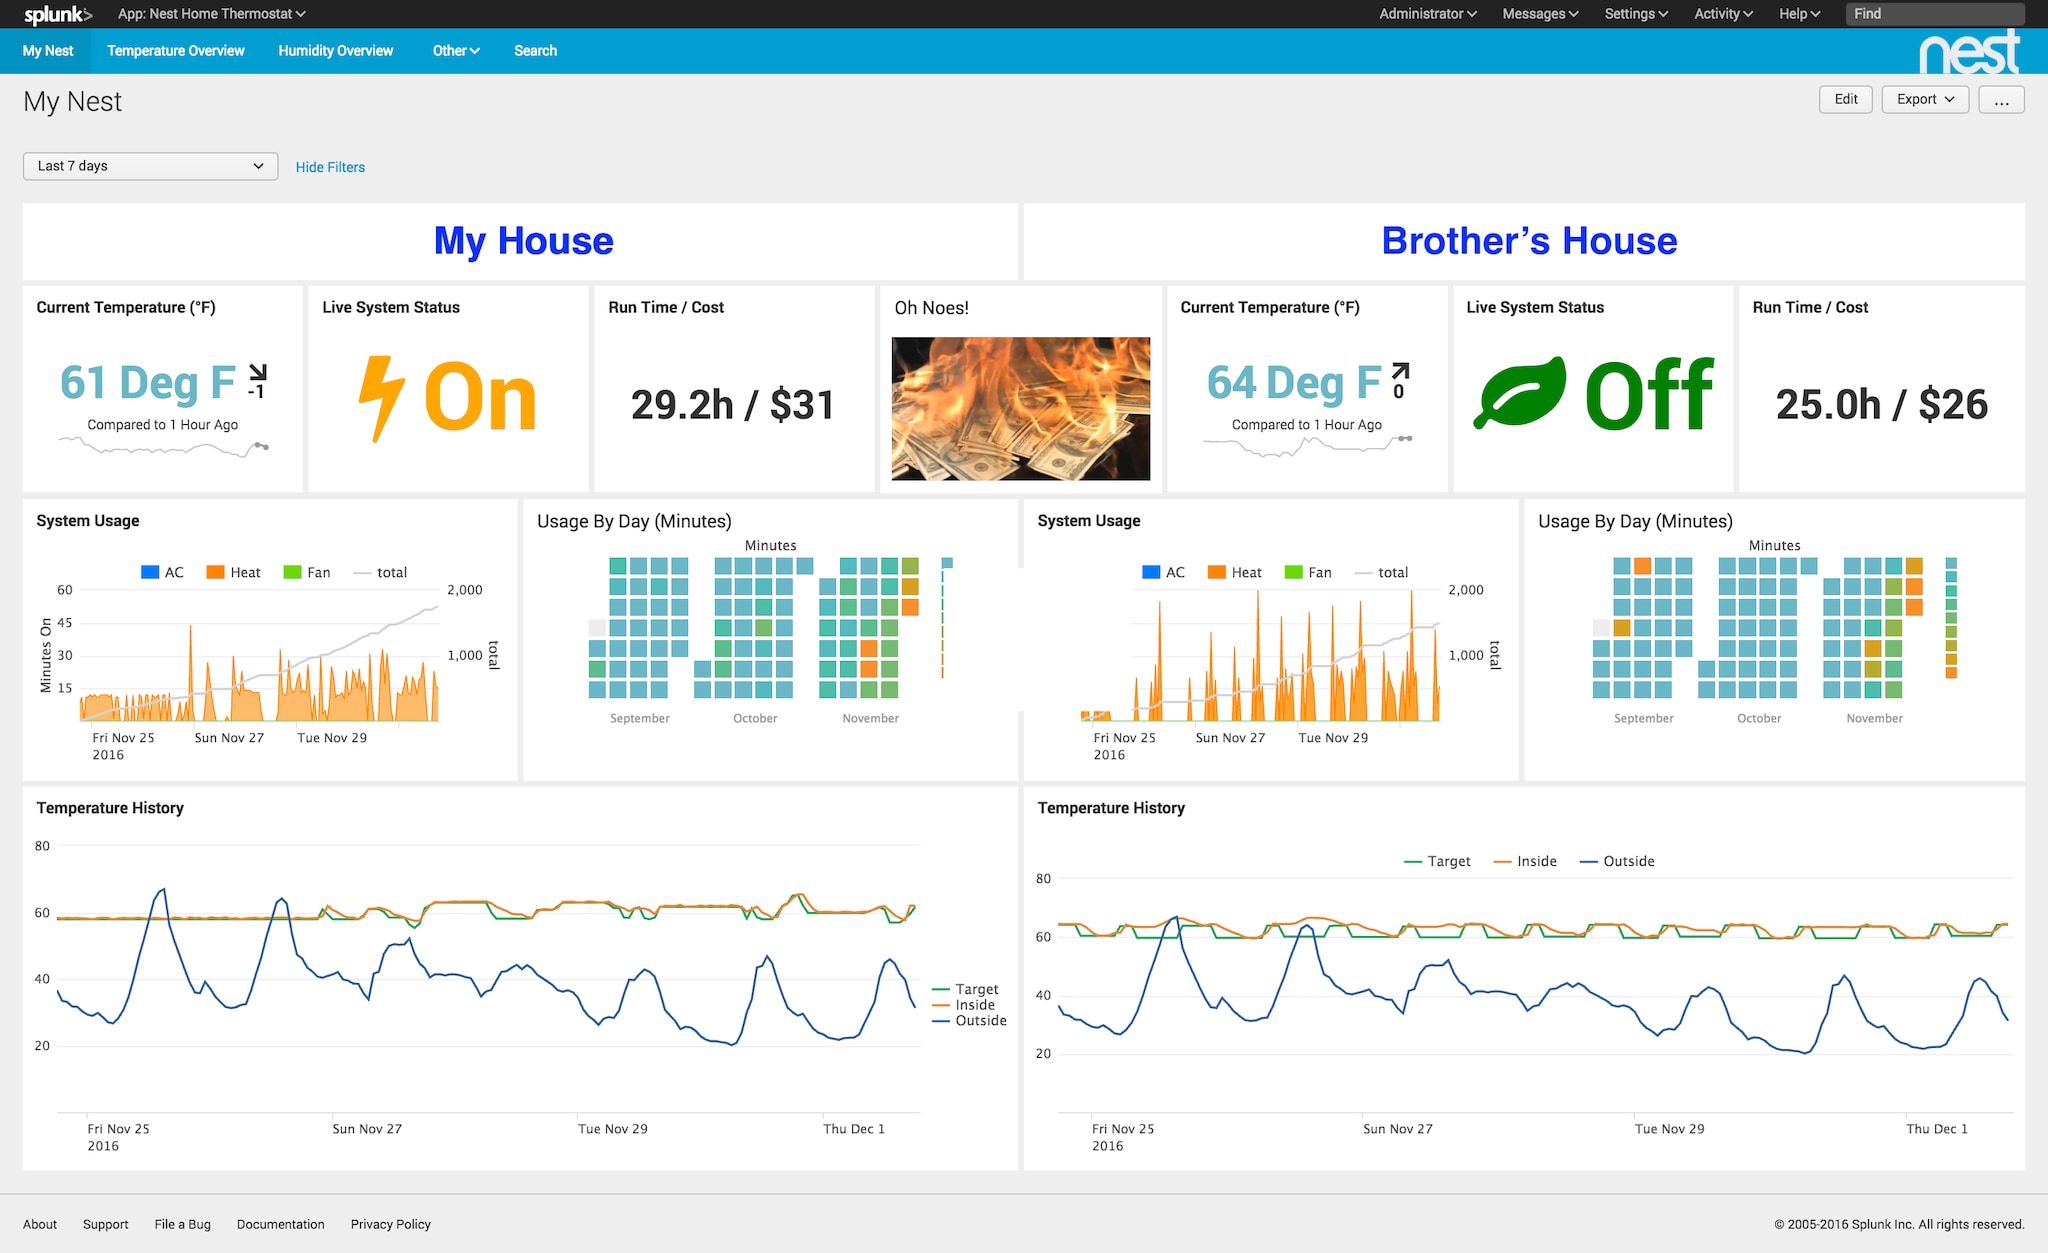
Edit 02/03/2017: bellow you can find a screenshot from the Nest System of Splunker Stephen Luedke – fit’s nicely to this topic and might additionally inspire you!