Capturing Akamai Data with Splunk
Tips & Tricks Splunk#### UPDATE ####
Some of the information in my article below is now out of date. For more information on capturing Akamai data or the HTTP Event Collector, please visit apps.splunk.com
Before we begin, I would like to give a very big and very public “Thank You!” to all of the people that have assisted with this, especially Jason Conger. If you will be attending .con2015 in a couple of days, please be sure to stop by the Akamai booth.
If you’re an Akamai user, you can’t afford to not monitor your data. By pulling it into Splunk, you can easily monitor SLA’s of cloud service providers, gain instant visibility into applications, and monitor security events and incidents across your environment.
A lot of our customers have requested guidance on how to best capture Akamai’s “Cloud Monitor” feed. If you’re not familiar with Cloud Monitor, it is a real-time cloud based HTTP Push API that delivers all of your data in JSON format. There are only two things that you need to make this work;
- A publicly accessible ‘receiver’
- The infrastructure to handle the load
When a ‘receiver’ is mentioned, what I mean by this is some accessible IP or URL that is capable of routing HTTP data to you internal network. If you already have some mechanism to receive HTTP data in your environment, use a Splunk universal forwarder to monitor the location that receives the data. If you do not already have some mechanism in your environment to receive HTTP data, you can use one or more Splunk Universal Forwarders to receive the HTTP data. You could use a load-balancer in the traditional sense, or a simple DNS entry that round-robins between the forwarders. That choice is up to you and your company standards. You could write directly to indexers, but caution should be used until you are certain of what your data ingestion will be. Depending on the size of your Akamai feed, you could receive as little as 20 gb or tens of terabytes per day.
Onto the data capture;
Unless you’ve written your own HTTP listener, we’re going to need to use a non-traditional route to capture the data. In this case, we’re going to write directly to a universal forwarder’s REST API.
For more information regarding writing to the Splunk API, you can click here.
We will first need to create user credentials for connecting Akamai to Splunk. You can do this via the GUI or in our case, with the command line:
./bin/splunk add user akamai -role user -password password
Next, use python to encode the credentials
Python –c “from base64 import b64encode; print ‘Authorization: Basic %s’ % b64encode(b’akamai:password’).decode(‘ascii’)”
You will receive a response similar to the following:

This bit is important and you will need to pass it along to Akamai and we will reference it later. Also… please don’t ever use this particular user/password combo as now the world has the encoded string.
Ultimately your data will need to go to https://YOURRECIEVER.yourcompany.com:8089/receivers/stream, which is the URL (or IP) and port which will be listening.
However, you will need to contact your Akamai technical resource and request two things.
- That Akamai pass the base 64 encoding of both the username and password, in our case ‘YWthbWFpOnBhc3N3b3Jk’ within the header .
- And that the following parameters are passed via a custom ‘Cloud Monitor Config’:
https://YOURRECEIVER.yourcompany:8089/services/receivers/stream?check-index=false&sourcetype=json&source=akamai
Note the following arguments:
- check-index=false must be set, otherwise Splunk will complain
- sourcetype will set the sourcetype and it is json. It is recommended to keep the sourcetype as json in order for better field extraction.
- source=akamai It is recommended to keep the source as akamai as the Splunk App for Akamai(coming soon!) use an event type that looks for data with the source set as akamai. The event type can be modified if desired.
That’s all there is to it! Once your Akamai resource makes the appropriate changes for you, you’re all set.
By default your new Akamai data will have the sourcetype of json, with a source of “Akamai” and be placed in the index “main”.
On to Scale… When starting to index the data be mindful of the limits of your forwarder(s). It is quite helpful to change the limit on thruput. You can find more information regarding changing your limits here.
You may also wish to construct several searches to monitor the forwarders at this time.
To view thruput:
index=_internal "group=thruput" host=my_indexers* | timechart span=15m avg(instantaneous_eps) by host | addtotals
To view blocked queues:
index=_internal source="*/metrics.log" blocked="true" | stats count by host
or to search for errors:
source="/opt/splunkforwarder/var/log/splunk/splunkd_access.log" | timechart count by status
Depending on your expected volumes from Akamai, a simple heavy weight forwarder may be enough, or you may need to use several forwarders and a load balancer with an architecture similar to the following:
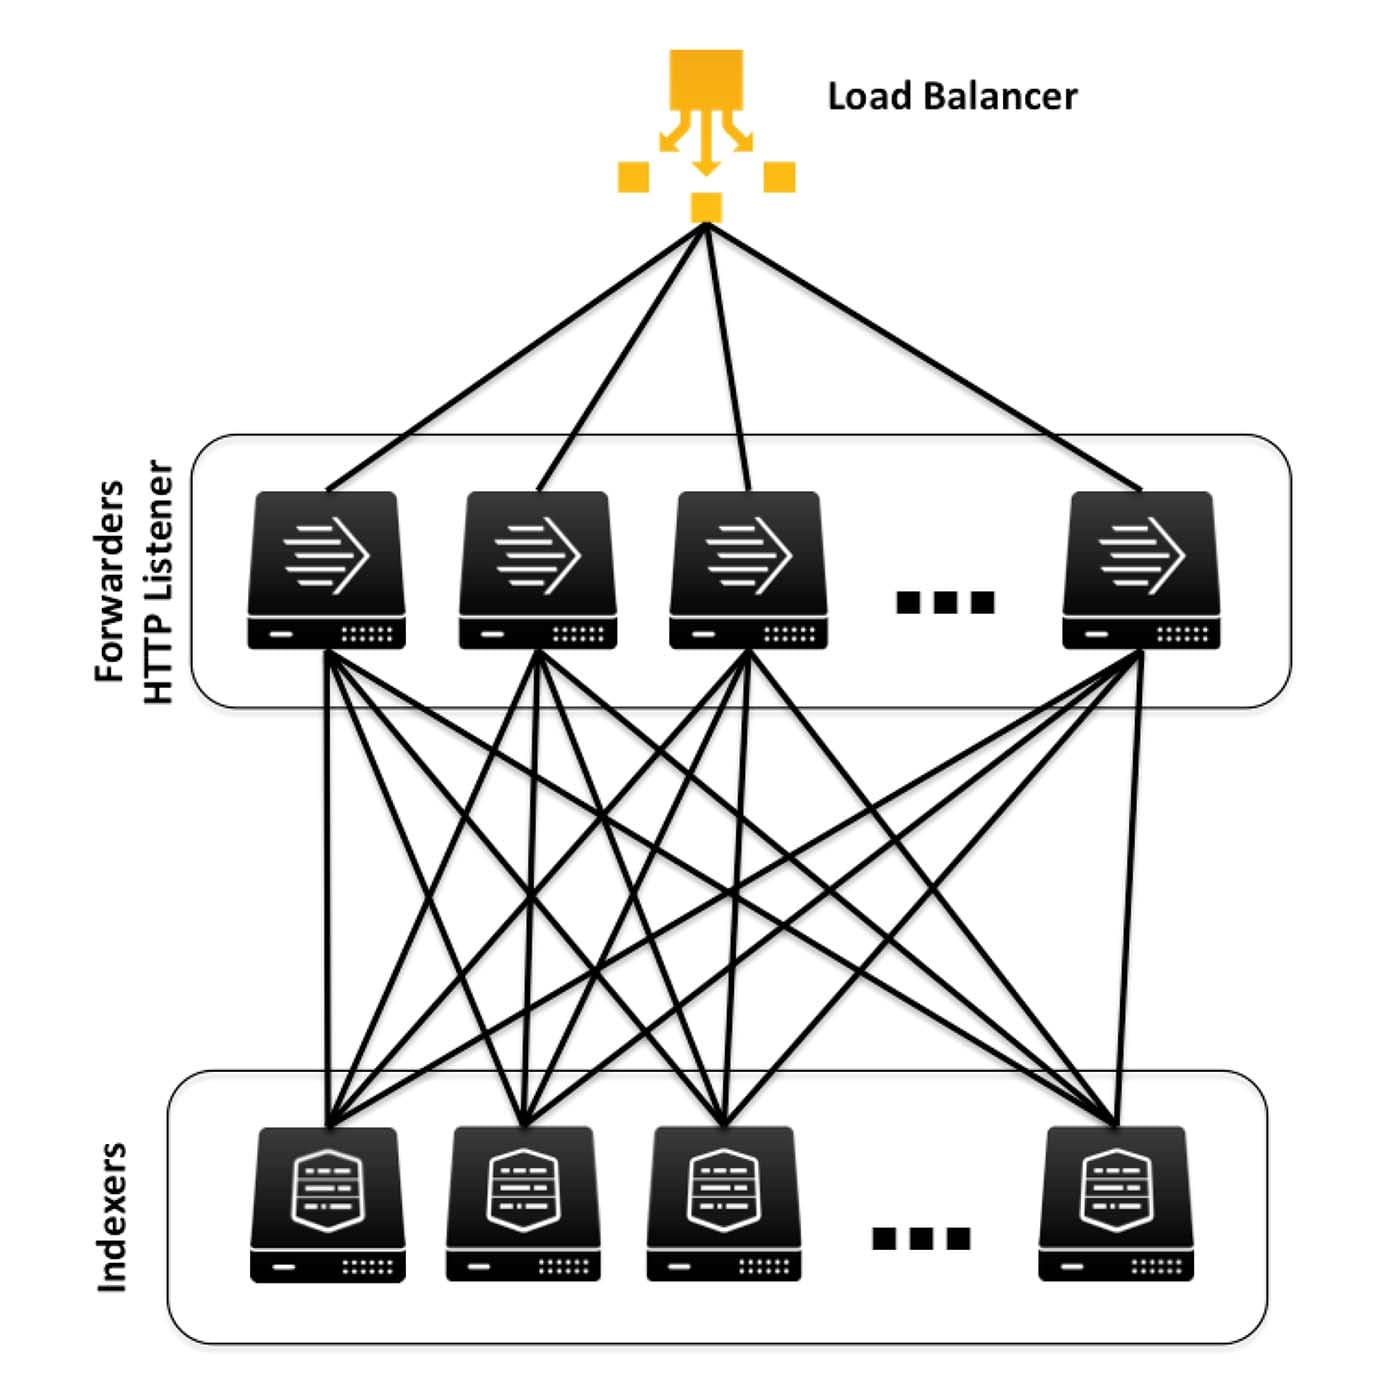
----------------------------------------------------
Thanks!
Dennis Bourg