Metrics pipeline management and visibility into usage
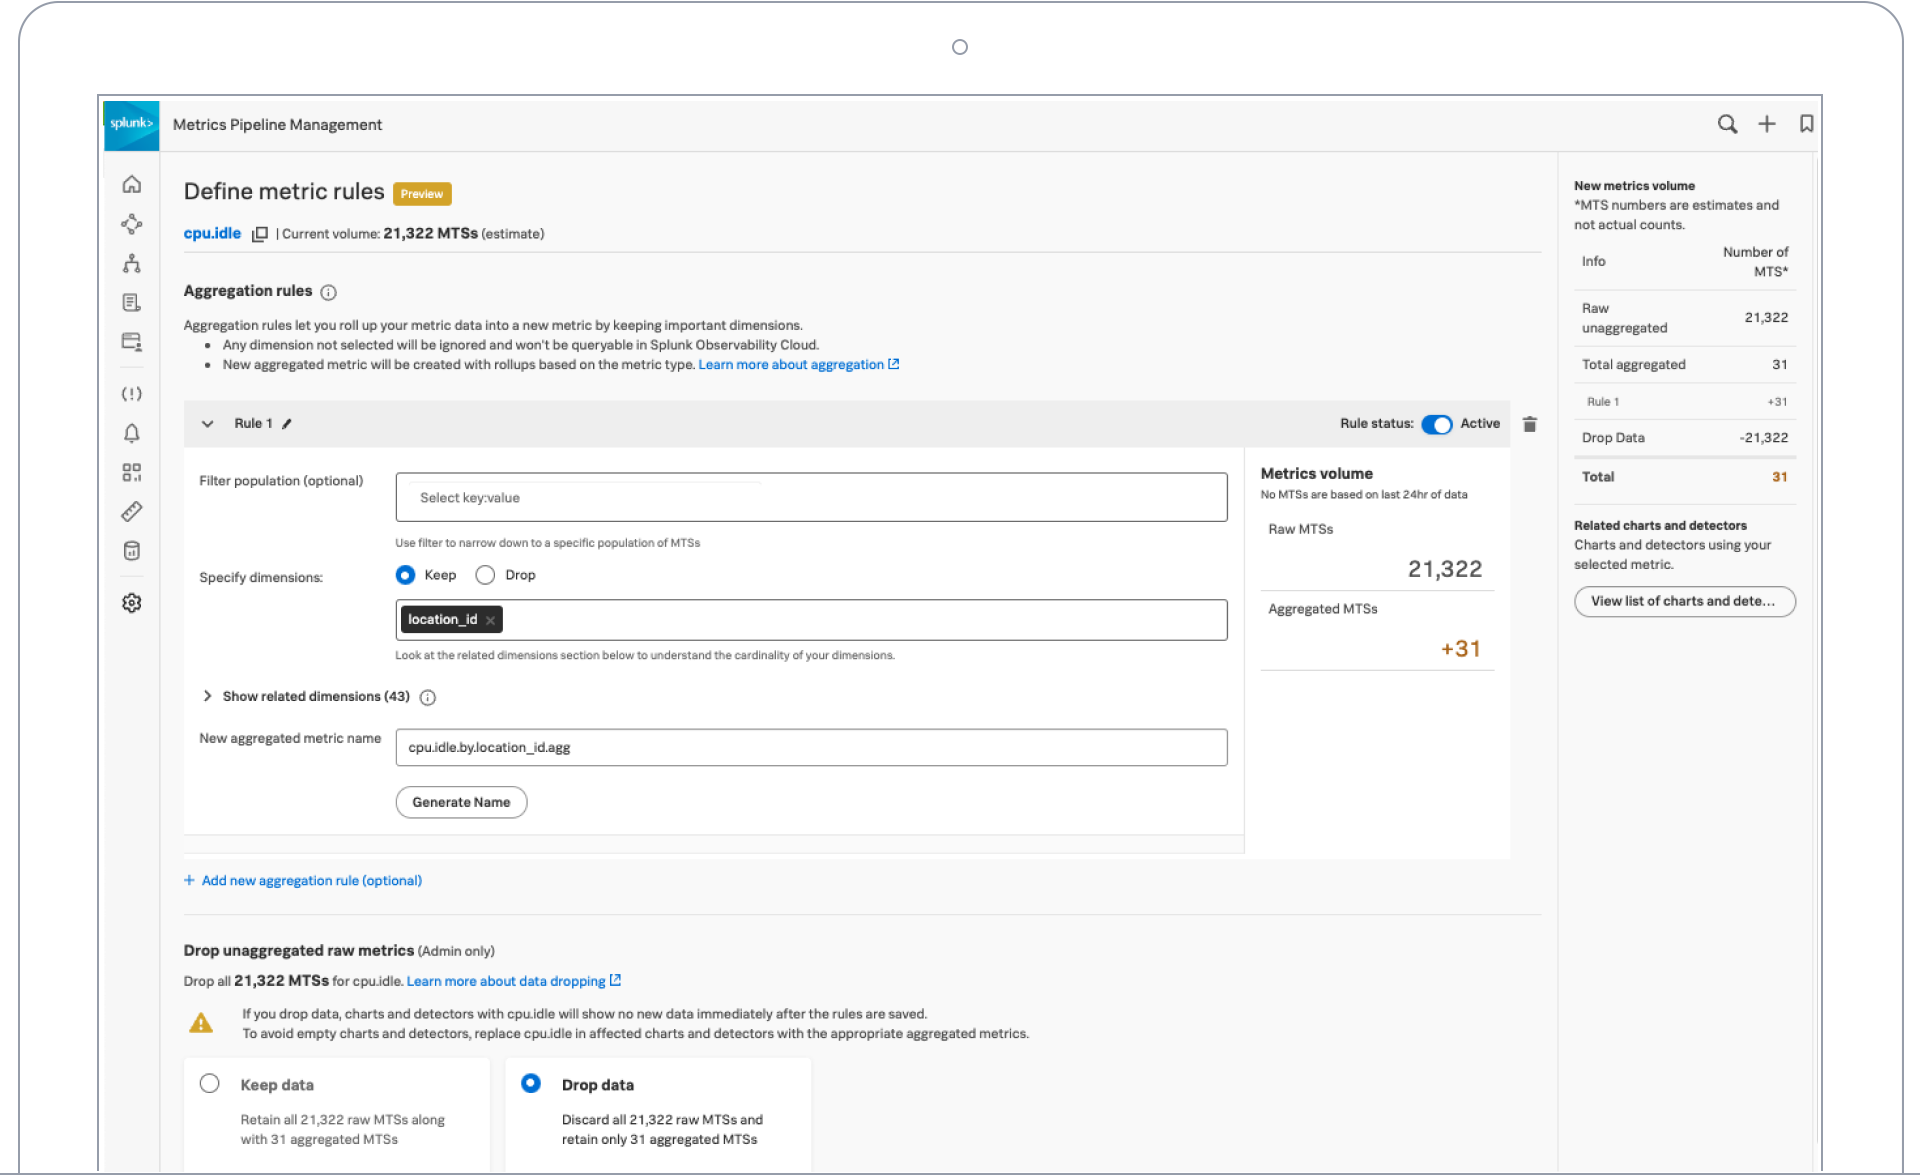
Metrics pipeline management
Control metrics volume at the point of ingest without re-instrumentation to reduce metrics volume and optimize observability spend. Aggregation and data-dropping rules make it easy to control how you ingest and store before they are ingested. This helps you keep the metrics you need and discard the less important high-cardinality metrics you don’t. To keep costs under control, you’ll only pay for what you store.
Metric time series (MTS) creation and usage analysis
Monitor use and avoid overages with detailed usage reports. Detailed MTS creation and usage analysis provide usage transparency. Information on MTS usage in our platform, cardinality, and distribution across teams/tokens help users identify optimization opportunities.
Complete visibility across any environment
Full-stack observability
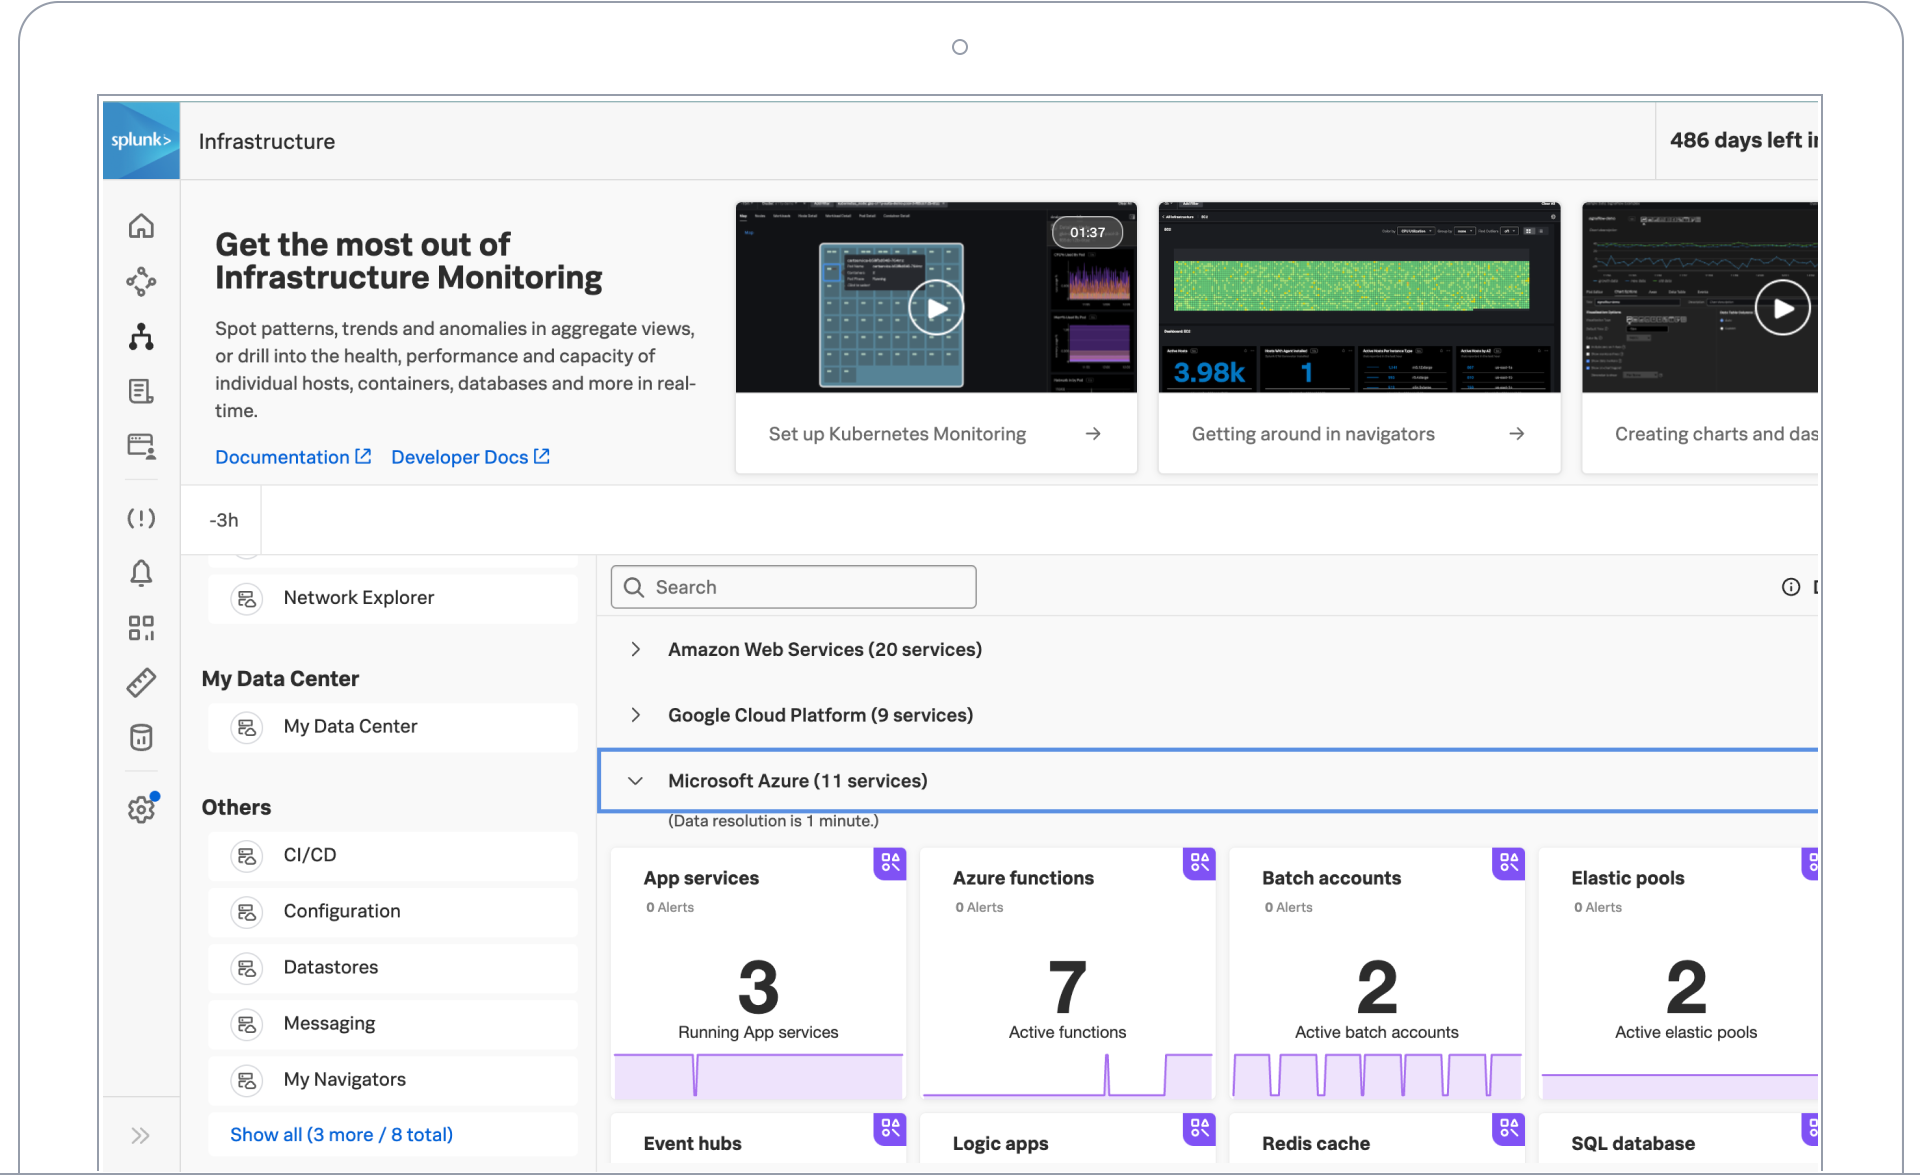
Infrastructure and application performance are interdependent. To see the full picture, Splunk IM provides seamless correlation between cloud infrastructure and the services running on top of it. Splunk will let you know if your application acts out because of memory leakage, a noisy neighbor container or any other infrastructure-related issue. Splunk IM is also cloud agnostic. Splunk ingests metrics and metadata with integrations into all of the popular cloud providers and their services (e.g., AWS, Azure, GCP, etc.) for fast time to value without the need to manage agents or plugins.
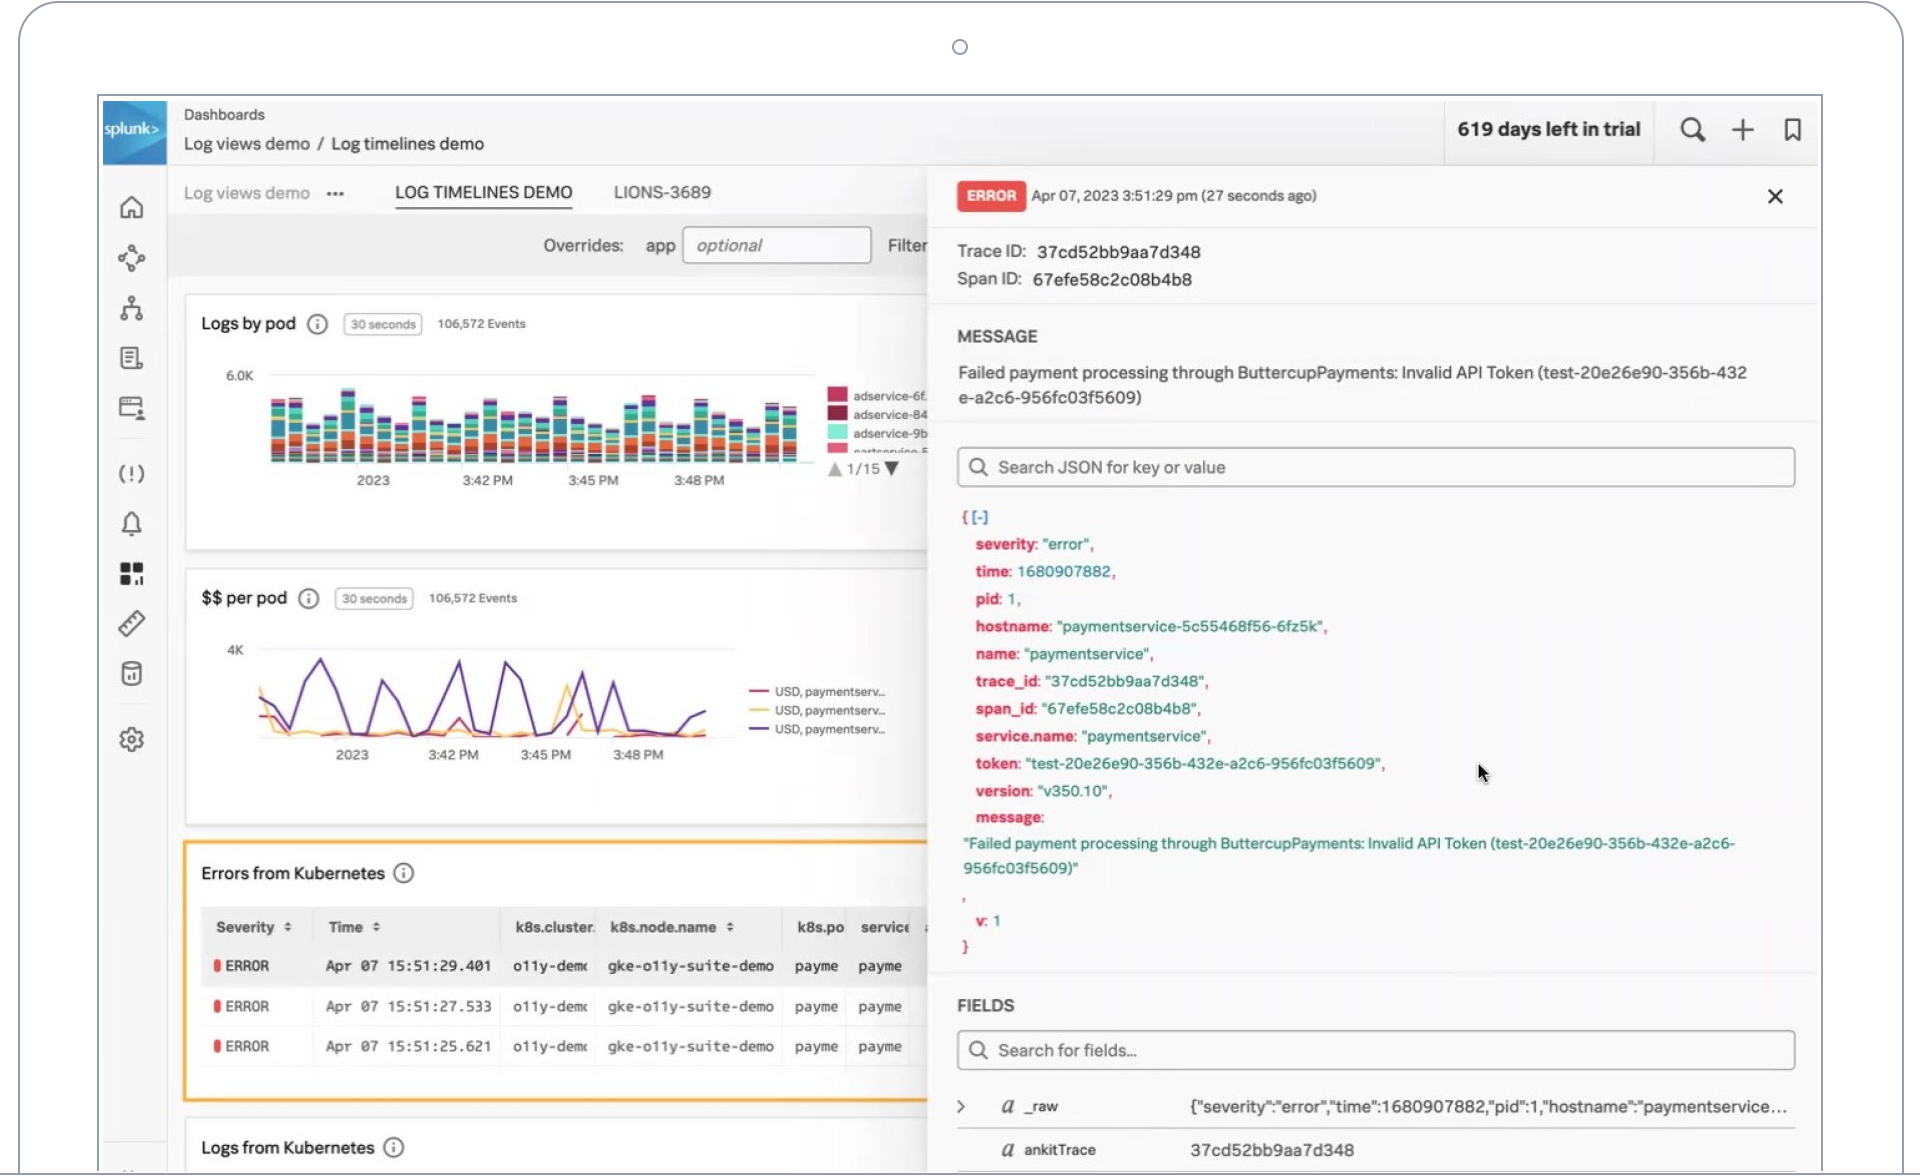
Deep data linking with Splunk Platform, logs in Observability Cloud
Carry the context of your chart into solutions like Splunk Enterprise or Splunk Cloud for deeper insights with the Content Pack for Splunk Infrastructure Monitoring. Log Observer Connect also centralizes observability log data alongside metrics in Splunk IM to eliminate context switching, shortening root cause analysis. Log views in dashboards combine log messages and real-time metrics together on one page with common filters and time controls for faster in-context troubleshooting.
300+ OOTB integrations
Splunk supplies hundreds of ready-to-use integrations with popular OSS, cloud infrastructure and services. Integrations automatically pull standard metrics from the services and feed them into pre-built dashboards for rapid visualization. Integrations go beyond just ingesting data to incident response systems, like Splunk On-Call for rapid issue resolution.
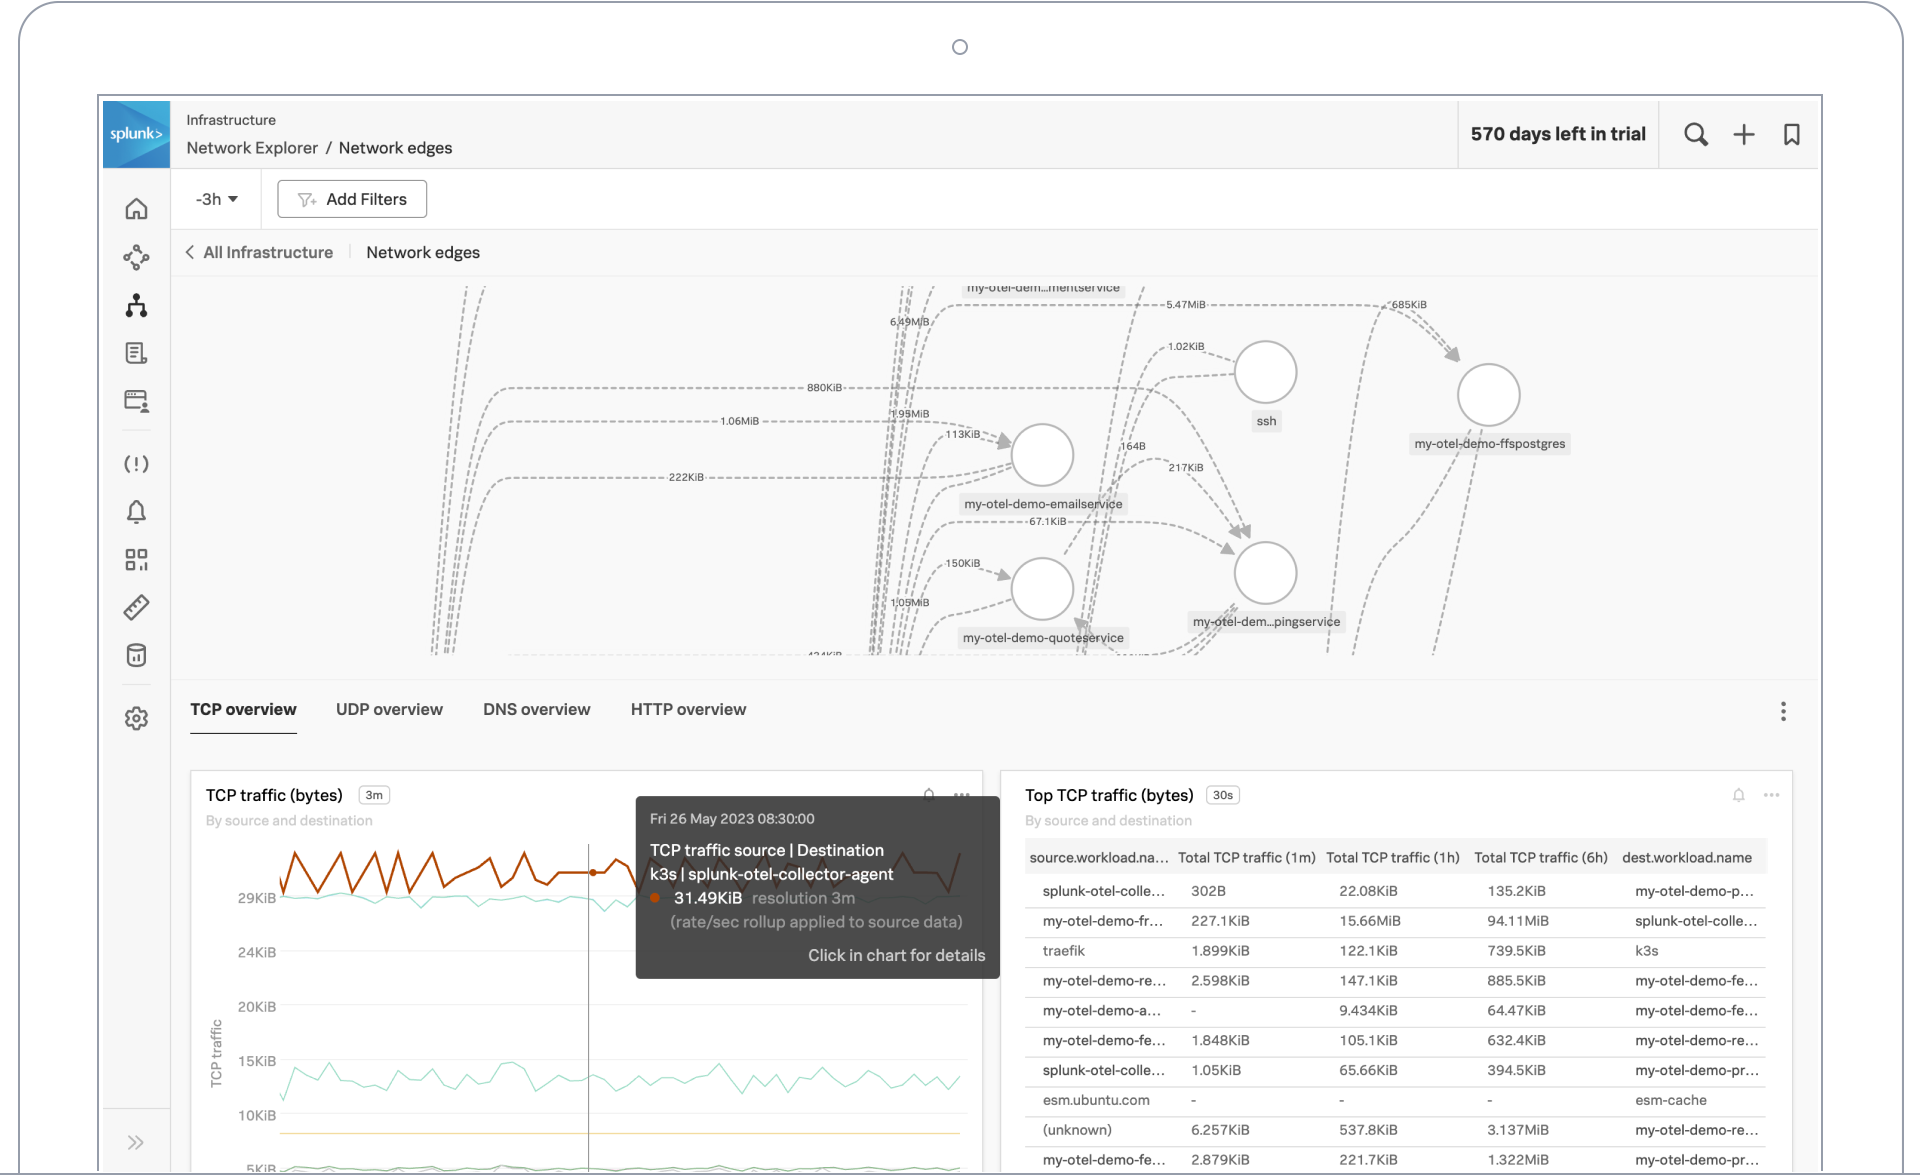
Automatic cloud network visibility
Using Extended Berkeley Packet Filter (eBPF) technology, Splunk IM’s Network Explorer collects fine-grained network telemetry data and correlates it with application metadata to provide a real-time view of all known and unknown service dependencies. Automatically detect and separate network outages from application issues in seconds.
Visibility for serverless functions
Splunk monitors the most popular FaaS services (AWS Lambda, Azure Functions, Google Cloud Functions) with Function Wrappers that provide metrics on total invocations, errors, durations and etc. in seconds.
Best-in-class Kubernetes monitoring
Kubernetes navigator
Kubernetes navigator is a turnkey and enterprise-grade monitoring solution for even the largest of Kubernetes environments. It provides an intuitive way to understand and manage the performance of Kubernetes environments.
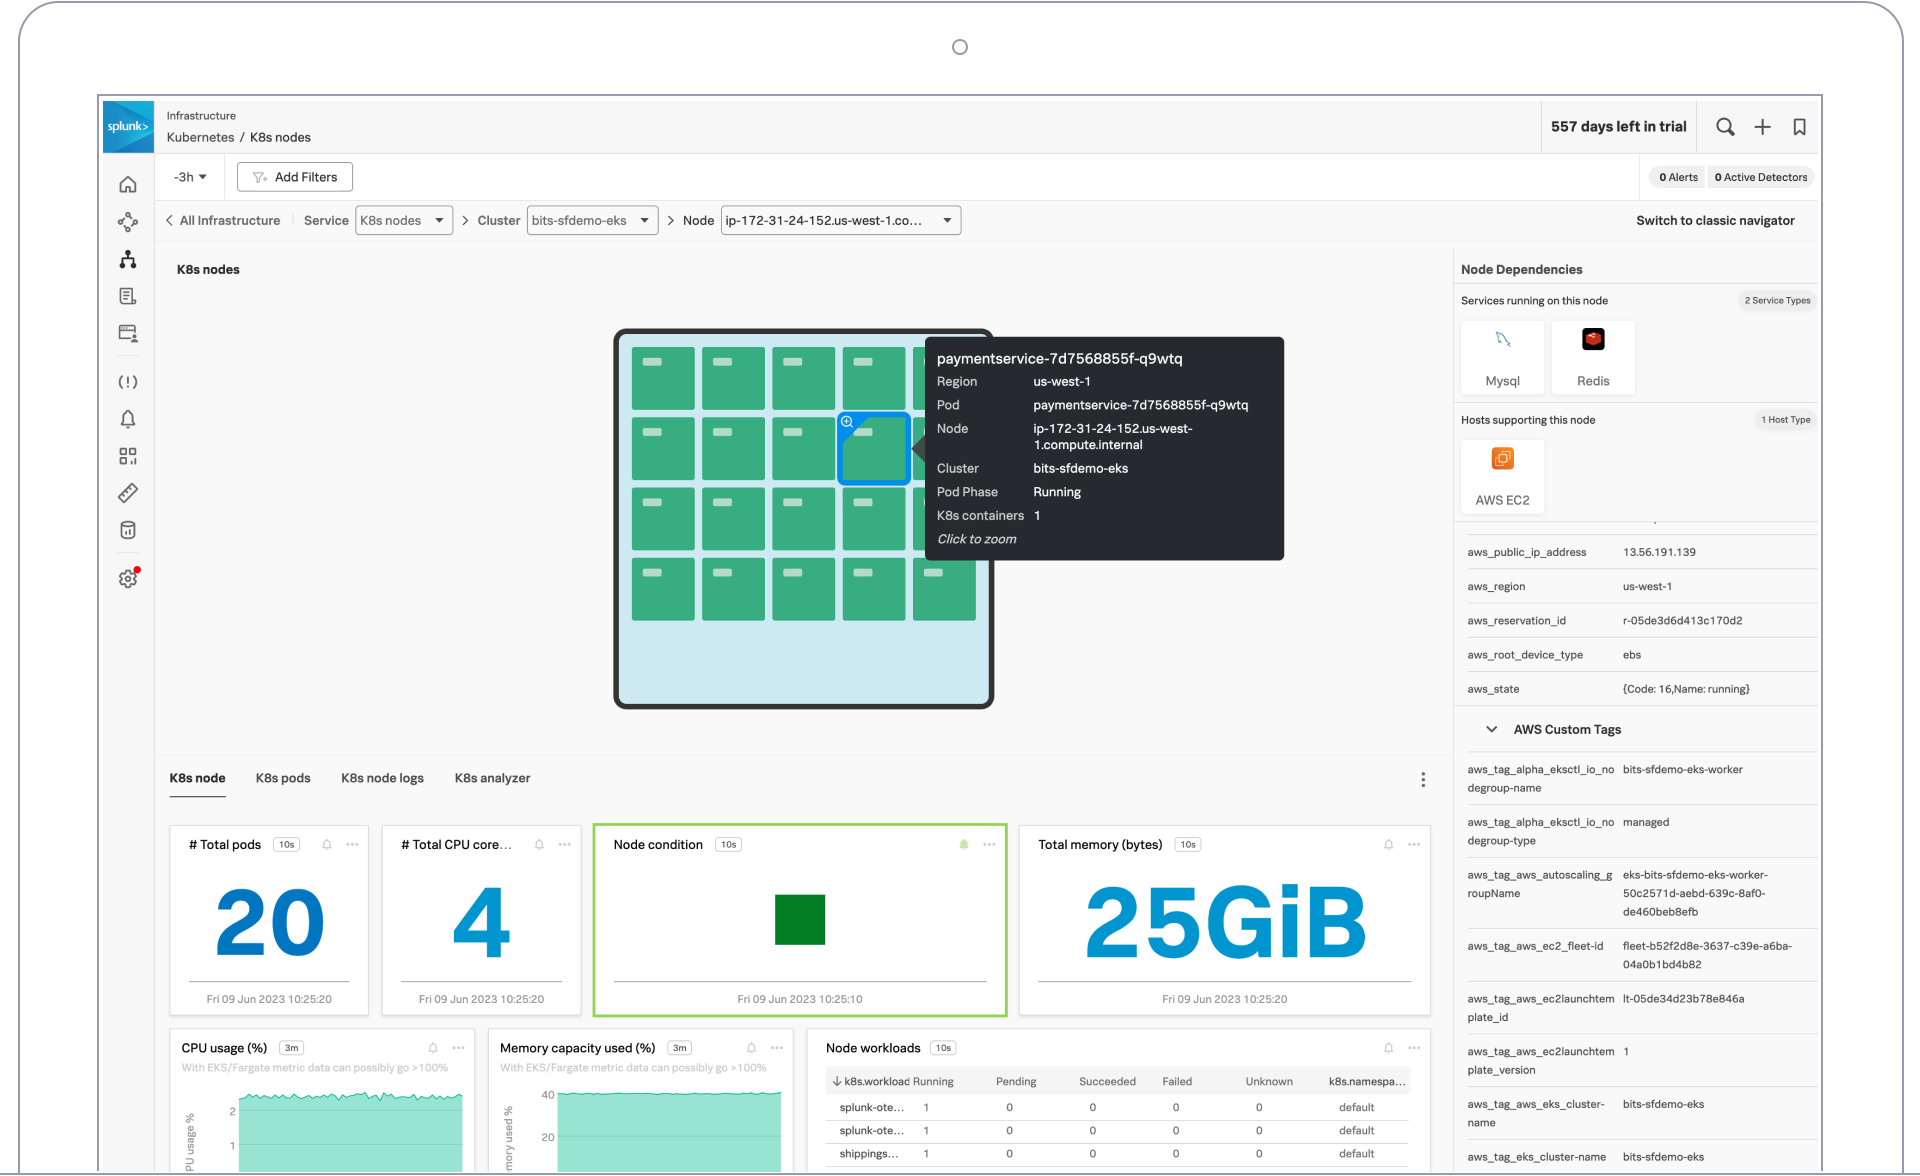
Dynamic cluster maps
Automatically discover and visualize the Kubernetes objects, their health and performance of container resources with dynamic cluster maps and pre-built dashboards.
Industry certified, customer trusted
HIPAA compliance
HIPAA (Health Insurance Portability and Accountability Act of 1996) is United States legislation that provides data privacy and security provisions for safeguarding medical information. The Security Standards for the Protection of Electronic Protected Health Information, commonly known as the HIPAA Security Rule, establishes national standards for securing patient data that is stored or transferred electronically. The complete Splunk Observability portfolio, including Splunk IM, is HIPAA compliant.
SOC2 compliance
SOC2 is a component of the American Institute of CPAs (AICPA)’s Service Organization Control reporting platform. Its goal is to make sure that systems are set up so they assure security, availability, processing integrity, confidentiality and privacy of customer data. Splunk Infrastructure Monitoring goes through SOC2 compliance on an annual basis and focuses on security, availability and confidentiality.


Splunk Protects
Splunk Protects is our promise to secure your data. We are committed to global and industry compliance standards. We prepare for incidents and we help you prepare, respond and remediate.