Deliver Winning Digital Experiences With User Behavioral Data
Observability Wei LiThis blog was co-authored by Tom Bia
To deliver great digital experiences, teams need visibility from every angle. That includes traditional observability data such as latency, JavaScript issues, and load times to troubleshoot outages and performance degradations. Equally important is understanding how users engage with your product: which features they adopt, where they struggle, and what behaviors lead to drop-offs or conversions.
Today, we’re introducing Digital Experience Analytics in Splunk Observability Cloud, providing deep, intuitive insight into user behavior across your digital products. By unifying behavioral data with observability signals from real user monitoring (RUM) and application performance monitoring (APM), Splunk helps Product, UX, and Engineering teams pinpoint friction, increase conversion rates, and prioritize engineering work more effectively. All of this is powered through a single, lightweight OpenTelemetry instrumentation agent.
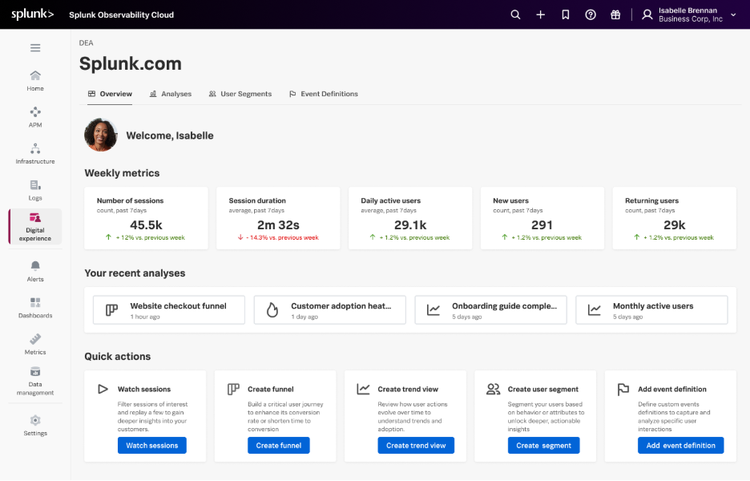
Understand Real User Behavior to Drive Digital Growth
Digital Experience Analytics automatically captures user behavioral data by tracking every meaningful user action, including page views, button clicks, logins, sign-ups, purchases, and more. These rich, contextual events power a wide range of analytics and visual insights.
For example, you can instantly build a time-series chart for any event to understand engagement or feature adoption trends. Imagine you have just launched a new ‘Generate Summary’ button powered by AI and want to monitor adoption. Digital Experience Analytics allows you to visualize usage over time, zoom into specific spikes or dips, and quickly explore the underlying user sessions that influenced those patterns.
Soon after this initial release, Digital Experience Analytics will also surface frustration signals that detect user behaviors such as rage clicks or dead clicks, which often correlate with negative experiences or disengagement.
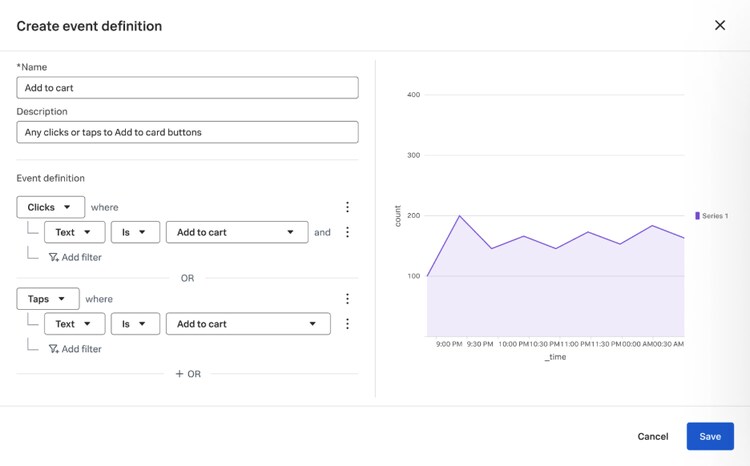
In addition to automatically collected events, both technical and non-technical users can define custom events using our Element Picker, which allows users to create events directly from the UI without writing code.
To understand how users navigate your application, Digital Experience Analytics provides User Journey Maps, which reveal the most common paths users take, including the steps leading to or following any event of interest. This helps uncover user journeys and behavioral patterns you may not have anticipated, making it easier to design smoother, more intuitive experiences.
Continuing the example above, imagine you have introduced a new “Generate Summary” button in your application. With User Journey Maps, you can see the most common paths users take before clicking the button, such as navigating from the dashboard or searching for a specific dataset, as well as what they do afterward. You might discover that many users abandon the flow immediately after clicking the button due to a slow load time or a confusing confirmation step, revealing a friction point you can quickly address.
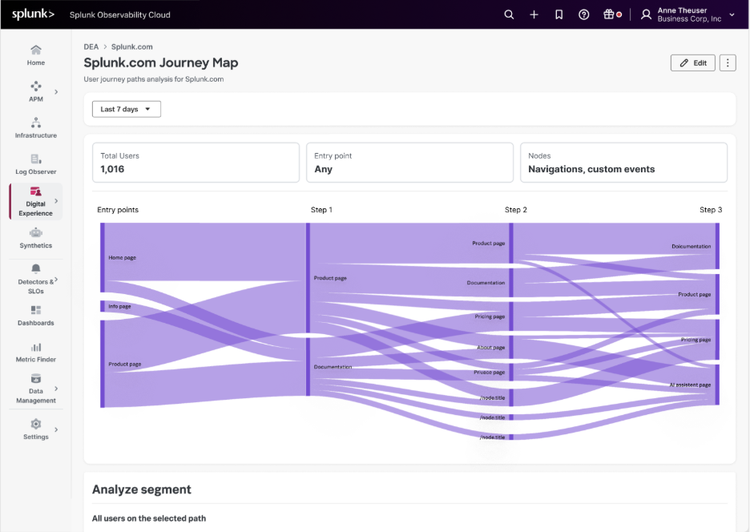
User Journey Maps reveal the most common paths users naturally take through your application.
Boost Conversion Rates of Your Key User Journeys
Every business-critical journey, such as e-commerce checkouts, SaaS onboarding flows, content subscriptions, or lead-generation forms, needs continuous monitoring to ensure users reach the outcomes you intend.
With Digital Experience Analytics, you can build multi-step funnels that represent your desired “happy path” and evaluate conversion rates at each step. Data is retroactive, which means you receive immediate insights based on historical events already collected rather than waiting for new data to accumulate.
For example, as a PM launching a new SaaS product, you can track adoption across key milestones such as:
- Landing on the “Get Started” page
- Completing onboarding
- Initiating key actions within the product
With a single funnel view, you can identify where users are dropping off and prioritize improvements.
To understand why drop-offs occur, you can open the associated sessions and view a Session Replay to see exactly what users saw. You can observe what they clicked, scrolled, hesitated on, or abandoned at that moment.
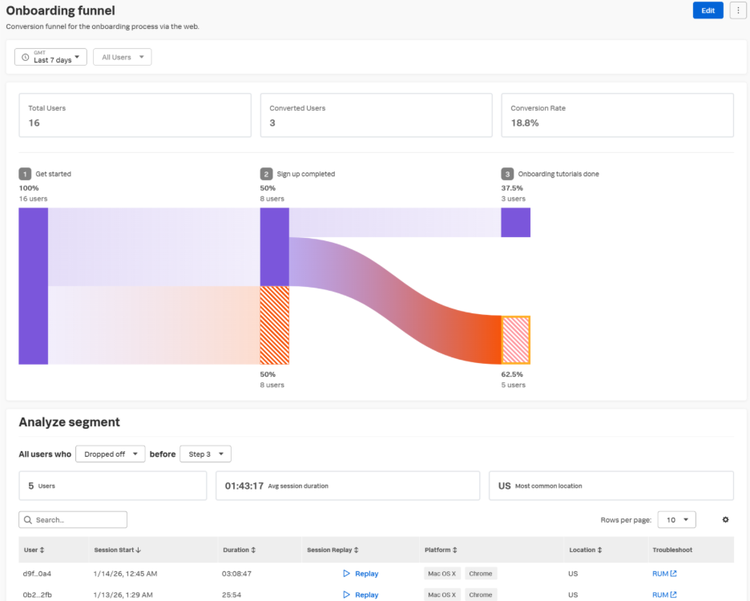
Conversion Funnels tracks conversion rates for critical user journeys.
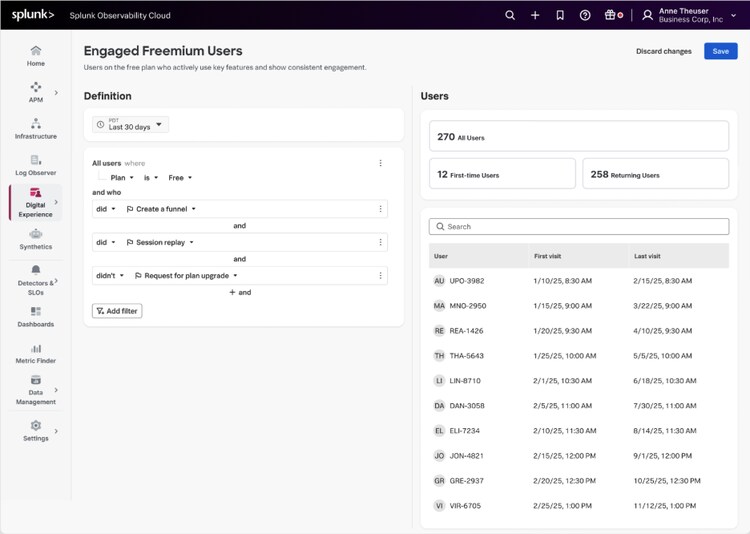
For deeper analysis, Digital Experience Analytics allows you to segment users by behavior (for example, first-time vs. returning users) or by attributes such as device type, location, or browser. These segments can be applied across Conversion Funnels, User Journey Maps, or any other analysis to compare experiences across cohorts and uncover opportunities for improvement.
Unify Observability and Digital Experience Analytics With an Easy Setup
A significant portion of digital experience issues are caused by underlying performance problems. When behavioral analytics and observability tools are siloed, teams must correlate data manually across multiple systems. This slows down investigations and makes it harder to identify root causes. Engineering teams also lack the user and business context needed to prioritize which performance issues matter most.
Splunk brings observability and digital experience analytics together in a single platform. With Digital Experience Analytics natively integrated into Splunk Observability Cloud:
- Product and UX teams can correlate funnel drop-offs with performance issues to accelerate troubleshooting.
- Engineering teams can prioritize fixes based on real user and business impact rather than alert volume.
For example, a PM might discover that a checkout flow is failing because the Place Order step is slow. With unified insights, they can share the exact session and correlated performance data from Real User Monitoring with engineers in a few clicks. This eliminates tool switching and manual data stitching while significantly improving MTTR, a capability that standalone Digital Experience Analytics solutions cannot easily deliver.
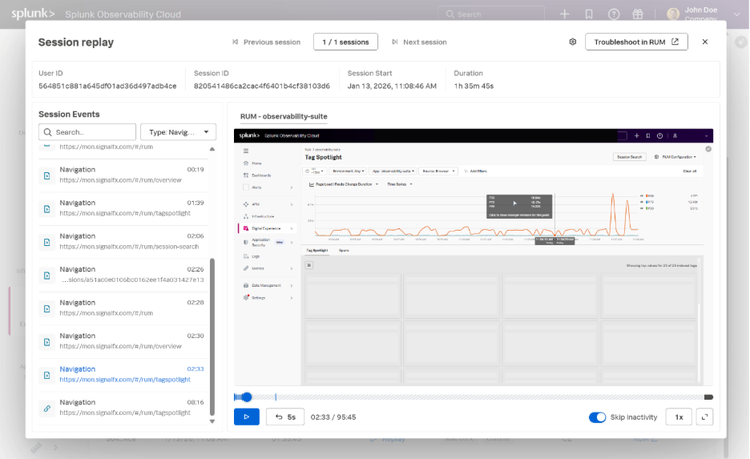
Digital Experience Analytics lets you jump directly from a problematic user session into Real User Monitoring for deeper troubleshooting.
Another benefit is reduced operational overhead. With Splunk’s single OpenTelemetry agent, you instrument once and automatically collect both frontend performance data and user behavioral data. This minimizes maintenance effort, configuration drift, and instrumentation complexity.
Start Analyzing User Behavior Alongside Performance Data Today
Digital Experience Analytics in Splunk Observability Cloud brings together behavioral insights and observability data to illuminate how users interact with your applications. This helps teams increase conversions, remove friction, and consistently improve digital experiences.
Visit our documentation to learn more or schedule a demo to see Digital Experience Analytics in action.
Related Articles

Assert Like You Mean It: How To Validate Outcomes in Synthetic Tests

Data Drivers: Hands-on The Wheel and The Data