observability
Business Journeys
Go beyond golden signal monitoring with curated business journeys to understand how app performance and user experiences impact business process health.
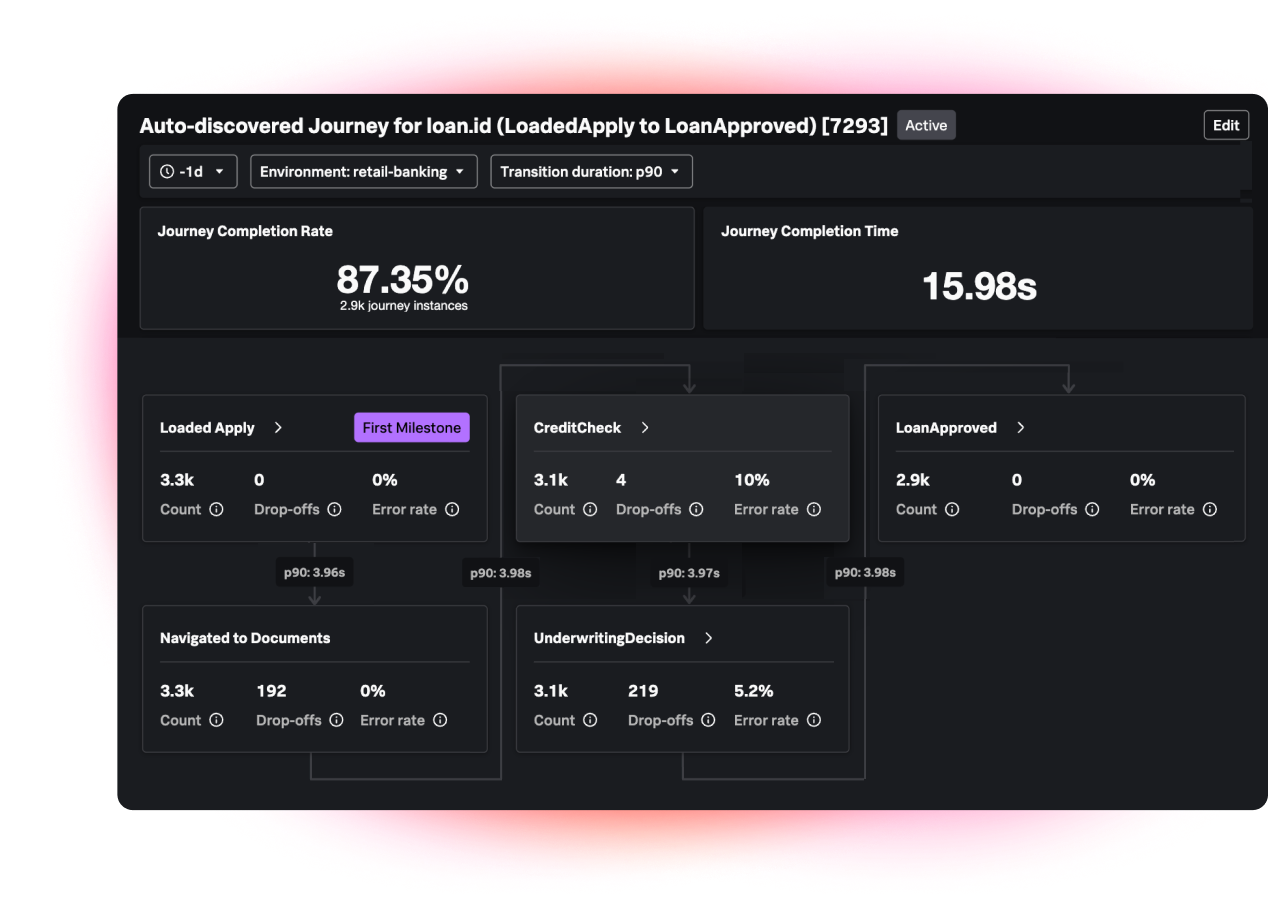
Automatically build dynamic business journeys from existing OpenTelemetry data
Skip the custom code, manual mapping, and brittle scripts. Business Journeys automatically discovers and builds complete workflows using the OpenTelemetry data you already have in Splunk APM and RUM. As your apps change, your journeys stay dynamically updated in Splunk Observability Cloud—with zero coding required.
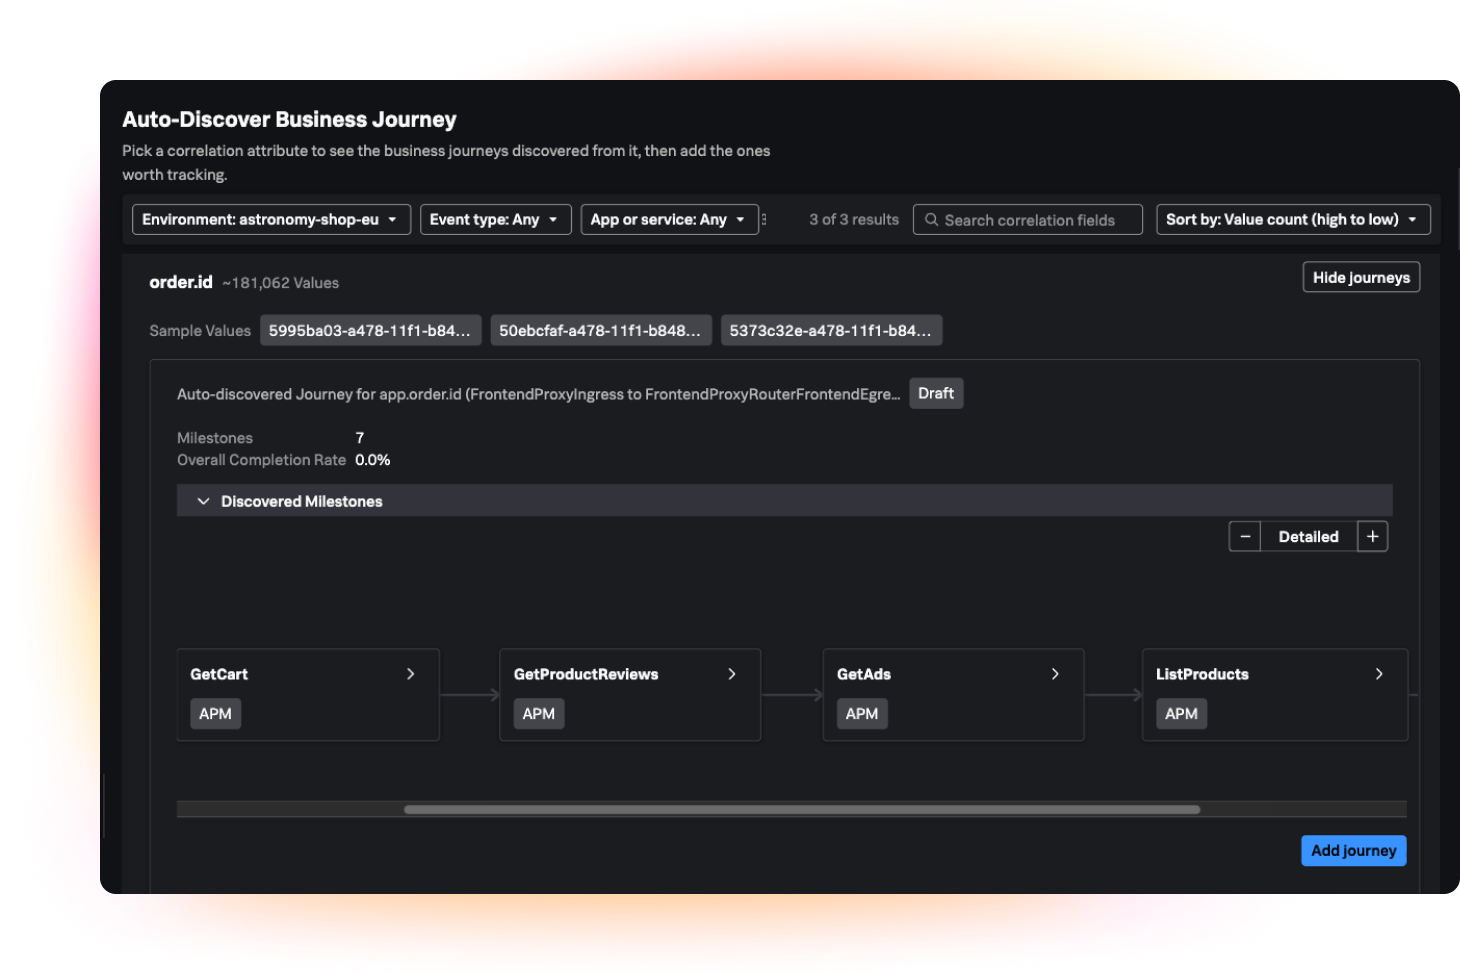
Monitor end-to-end business process health in real time
Track multi-step workflows like loan approvals, checkouts, or claims in real time. Get a single, consolidated view of step completion rates, transition times, and drop-offs across every stage—so you can instantly spot bottlenecks, measure performance against key business KPIs, and fix issues before they impact your bottom line and SLAs.
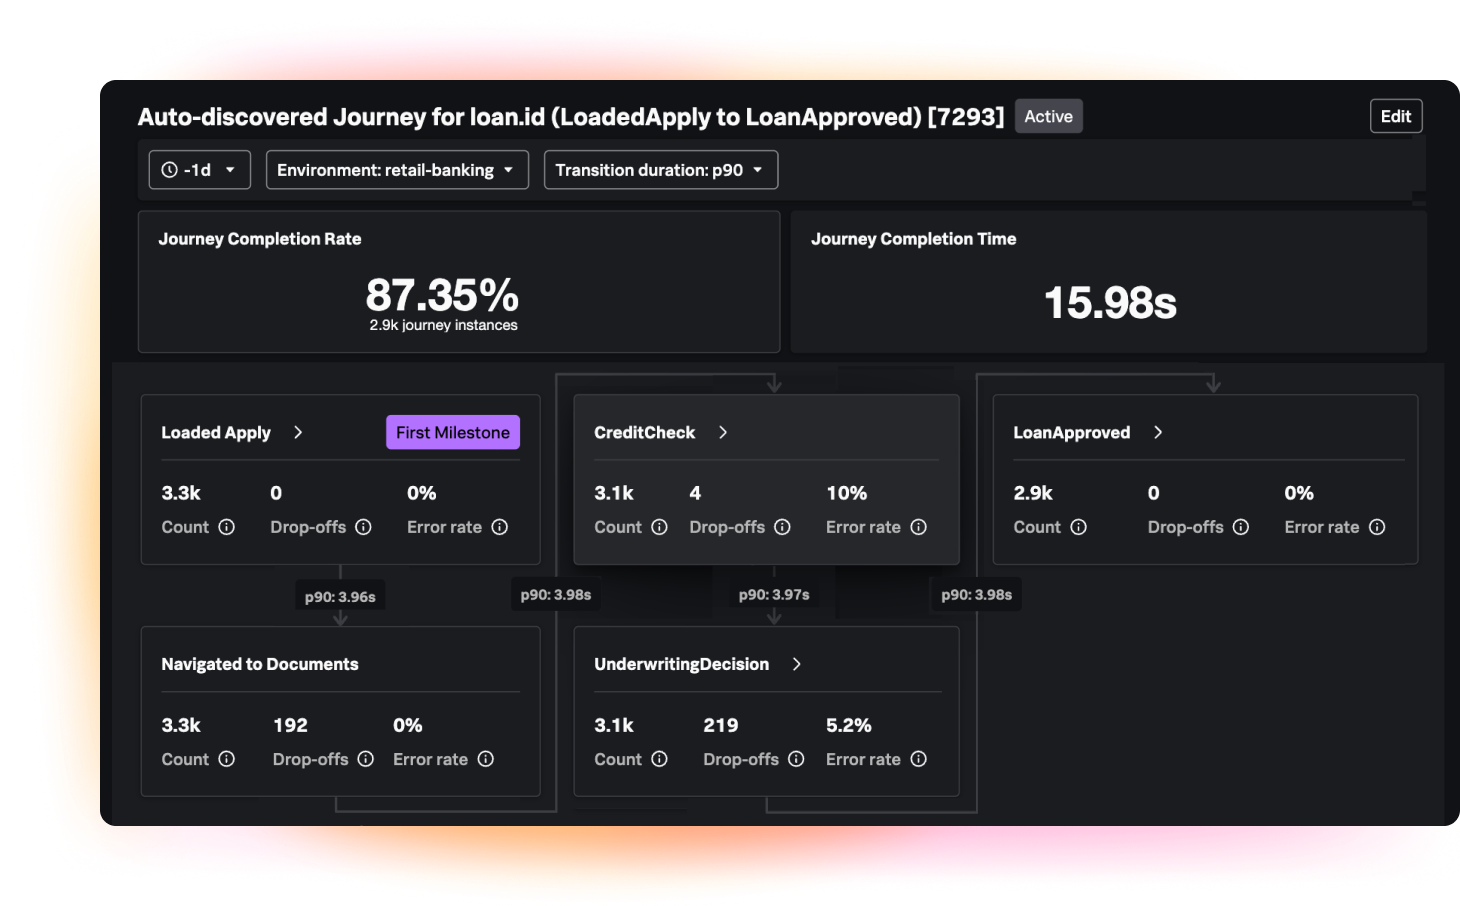
One-click to technical root cause
Stop guessing which technical issue is hurting your business. When conversion drops or a step breaches its SLA, pivot instantly from your journey view into correlated APM traces and RUM user sessions. Quickly pinpoint the exact code error, slow database query, or third-party API timeout to restore revenue-critical workflows.
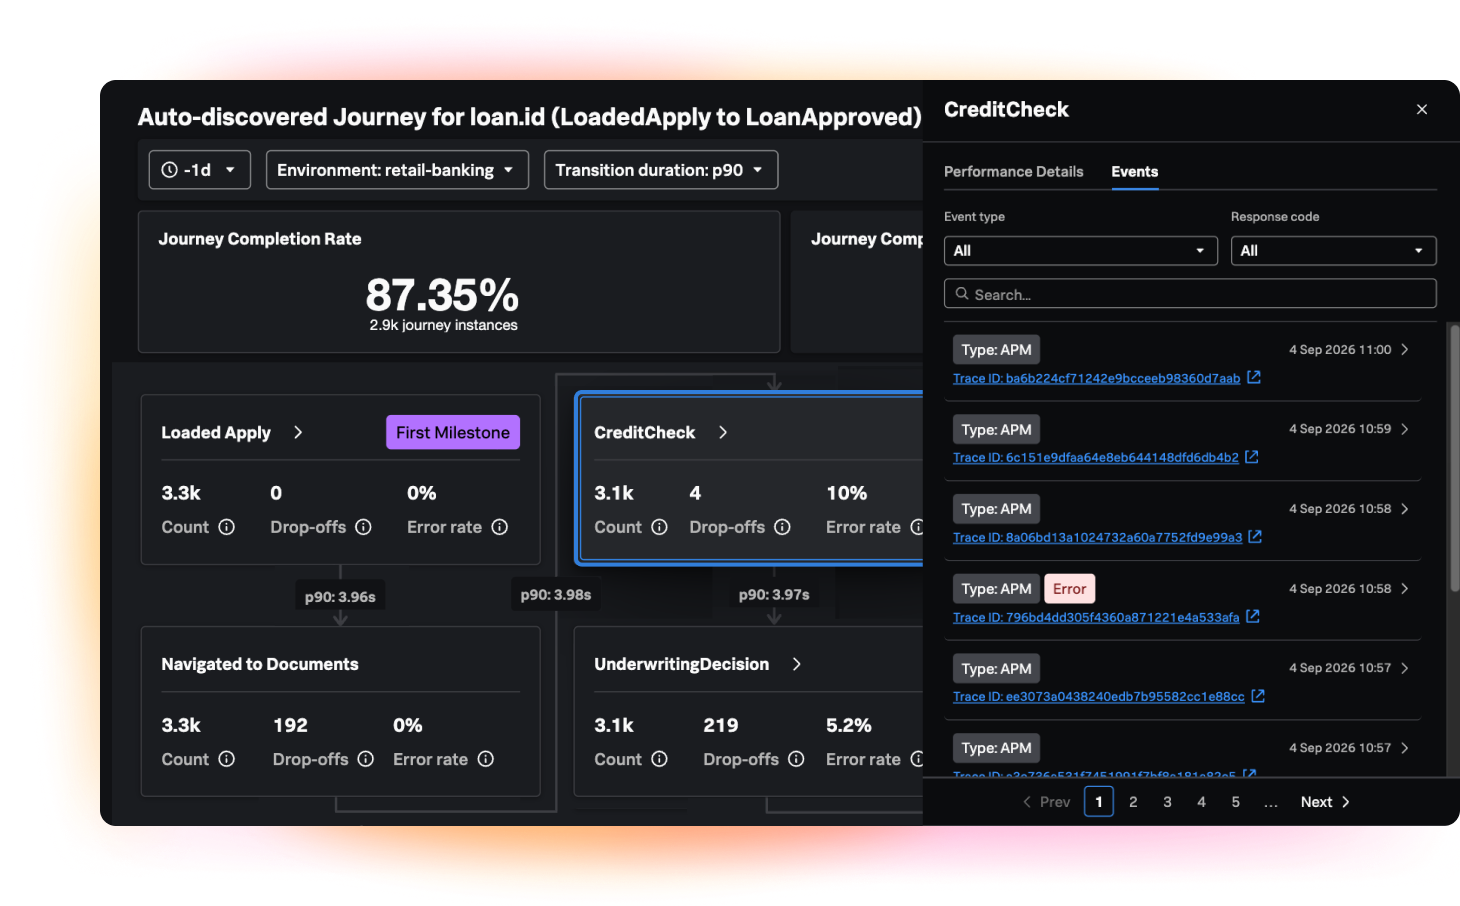
Features
Key features for Business Journeys

Milestone and bottleneck tracking
Identify process delays across every stage in real time. Track milestone completion times against SLA targets to quickly spot bottlenecks.

Non-linear journeys and branching
Real-world workflows are rarely straight lines. Natively map retries, conditional routing, fallbacks, and exception paths across distributed services without losing journey context or visibility.

Transition IDs
Link workflows when transaction identifiers change midway-such as connecting an initial web order ID to a payment reference and a 3PL fulfillment ID-unifying visibility without custom ETL pipelines.

Direct telemetry pivoting
Jump with one click from a stalled business transaction into correlated APM distributed traces, backend database queries, and microservice spans to isolate root causes in seconds.

Frontend user context
Bridge backend process health with frontend user experience. Correlate backend bottlenecks with Splunk RUM sessions to see exactly which users encountered errors, latency, or abandoned sessions.

Impact-driven prioritization
Cut through noisy alert storms by ranking technical incidents according to business process severity, transaction volume, and affected revenue rather than raw infrastructure error counts.



Business Journeys FAQs
Business Journeys is a capability within Splunk Observability Cloud that correlates technical performance data from APM and RUM with end-to-end business workflows. It allows teams to monitor business processes in real time and understand exactly how application performance impacts business KPIs.
While traditional APM focuses on technical "golden signals" like latency and error rates, Business Journeys maps these metrics directly to business outcomes. This allows you to track multi-step workflows—like checkout completion rates or loan approvals—and instantly see how technical bottlenecks impact revenue and SLAs.
No. Business Journeys automatically discovers and builds dynamic workflows using the data you already collect in Splunk Observability Cloud. It requires zero custom coding, manual mapping, or brittle scripts, and it updates dynamically as your applications change.
Yes. Business Journeys natively supports non-linear paths, branching, retries, and exception paths. Using Transition IDs, Splunk can even correlate disparate systems across ID changes—such as linking a web order ID to a fulfillment ID—without requiring custom ETL pipelines.
Business Journeys gives you impact-driven prioritization. Instead of treating all infrastructure errors equally, teams can rank technical incidents based on business process severity, transaction volume, and affected revenue, then focus on fixing the issues that matter most to your bottom line.
Related products
Splunk Observability Cloud
Unified visibility and real-time troubleshooting across any environment.
Splunk Cloud Platform
Search, analyze, visualize, and act on your data with a flexible and cost-effective data platform service.