Stop Guessing What Matters: Move Beyond Golden Signals to Curated Business Journeys
Observability Wes CooperKey takeaways
- Business Journeys connects frontend, backend, and business data to show exactly where processes like orders or loan applications are stalling.
- Teams can set up business journey tracking in four simple steps using existing OpenTelemetry data, without custom coding or heavy configuration projects.
- One-click access links a stalled business process directly to the technical root cause, helping teams prioritize fixes based on real business impact.
As enterprises scale AI and modern cloud architectures to drive business growth, engineering, ITOps, and business service owners need visibility from every angle. That includes golden signals such as latency, database errors, and service dependencies to troubleshoot outages. Equally critical is understanding how technical performance translates to end-to-end business execution: whether loan applications are progressing through underwriting, retail orders are being shipped and delivered on time, or customer onboardings are silently stalling midway through account setup.
Today at .conf26, we’re introducing Business Journeys in Splunk Observability Cloud, providing real-time, unified visibility into end-to-end business workflows. By correlating frontend user interactions (RUM) and backend microservices (APM) with business KPIs Splunk helps engineering, SRE, and business operations teams pinpoint cross-system bottlenecks, eliminate war-room guesswork, and prioritize remediation based on measurable business impact. All of this is powered seamlessly through your existing OpenTelemetry instrumentation.
The Three Lenses of Business-Driven Observability: Transactions, Customer, and Process
To achieve your business outcomes, you need to align your observability practice to measure and monitor 3 different types of journeys:
(via Business Transactions in Observability Cloud APM)
(via Digital Experience Analytics in Observability Cloud)
(New in Observability Cloud)
Single Service / API Call
User Frontend Interactions
End-to-End Business Workflow
• Error rates & exceptions
• Service dependencies & DB calls
• User friction & drop-off points
• Full session replays
• Cross-application bottlenecks
• Business SLA & drop-off compliance
These capabilities are designed to build seamlessly on top of one another:
- Technical Journeys monitor operational service reliability and infrastructure dependencies via Business Transactions in APM (within Observability Cloud).
- User Journeys track user engagement, conversions, and front-end friction via Digital Experience Analytics (within Observability Cloud).
- Business Journeys in Observability Cloud now connects the dots across your entire distributed architecture to verify whether critical business processes are successfully completed.
Explore more on business insights within Splunk Observability Cloud
In this blog, we will be focusing primarily on Business Journeys. To learn more about Technical Journeys (via Business Transactions) and User Journeys (via Digital Experience Analytics) in Splunk Observability Cloud, check out these deep dives and documentation:
- Business Transactions Blog: Monitor Cloud-Native & Hybrid Apps
- Digital Experience Analytics Blog: User Behavior Observability
Easily Curate Business Journeys with Automatic Discovery
Historically, setting up business journeys (aka business process monitoring) has been frustrating and time-consuming. Traditional approaches forced teams to manually tag telemetry across dozens of microservices, build brittle custom ETL data pipelines, or deploy heavy proprietary agents—only for the mapping to break the moment an application team pushed a schema update. As a result, business journey monitoring projects often took months of professional services to implement and were quickly abandoned.
Business Journeys in Splunk Observability Cloud eliminates this setup friction by building natively from the OpenTelemetry data you already collect in APM and RUM in Splunk Observability Cloud. Instead of massive custom configuration projects, teams follow a simple, four-step chronological path:
- Choose: Select one critical business outcome to monitor (e.g., loan origination, retail order fulfillment, claims processing).
- Discover: Pick an existing correlation tag from your active telemetry (e.g., orderId, loanAppId, claimId) to automatically discover journeys with milestones.
- Customize: Add, remove, or reorder milestones, configure branching logic, and connect external background systems via Transition IDs.
- Operationalize: Monitor cycle times and prioritize engineering fixes based on business impact.
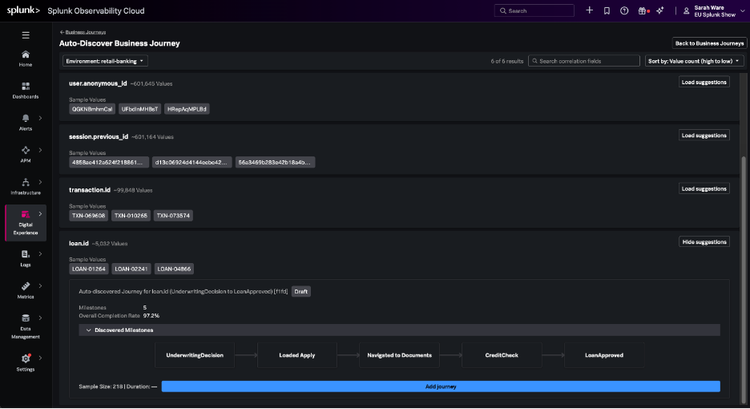
Figure 1: The Automatic Journey Discovery builder, enabling teams to instantly construct end-to-end business workflows from existing OpenTelemetry correlation tags with zero code refactoring or proprietary agents.
Operationalize: Monitor End-to-End Process Health in Real Time
Whether supervising a multi-day mortgage pipeline, an omnichannel retail fulfillment workflow, or automated insurance claims, Business Journeys automatically maps how transactions flow across every milestone—making it simple to measure performance against the KPIs that drive your business.
Business Journeys provides a single, consolidated view for tracking the progression, completion rates, transition latencies, and drop-offs across every stage of your critical business processes.
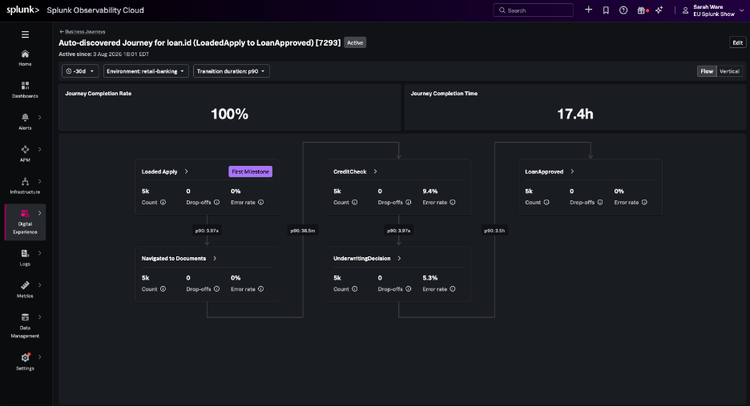
Figure 2: Real-time Business Journey dashboard tracking a multi-step financial loan approval workflow, highlighting transition times, conversion drop-offs, and an active SLA breach at the Document Verification milestone.
Key Capabilities Include:
- Milestone Progression & Bottleneck Identification: Pinpoint exact stages where transactions slow down (e.g., identity verification taking 46.2 hours instead of the 4-hour SLA).
- Non-Linear & Branching Journey Support: Real-world processes involve retries, conditional routing, and exceptions. Business Journeys natively accommodate complex, non-linear milestone topologies.
- Transition IDs for Connected Systems: Correlate disparate backend systems (e.g., order placement to 3PL warehouse fulfillment) where identifiers change midway through the process.
Connect Technical Root Causes Directly to Business Impact
When an alert fires during an incident, the first question leadership asks is never "Which pod crashed?"—it is "How many customer transactions are affected, and what is our business impact?"
Without unified correlation, engineers and AI assistants are forced to manually match APM trace IDs with CRM records or order logs. Business Journeys eliminates this manual toil by providing a seamless, one-click bridge from any lagging business milestone directly into underlying telemetry across APM and RUM.
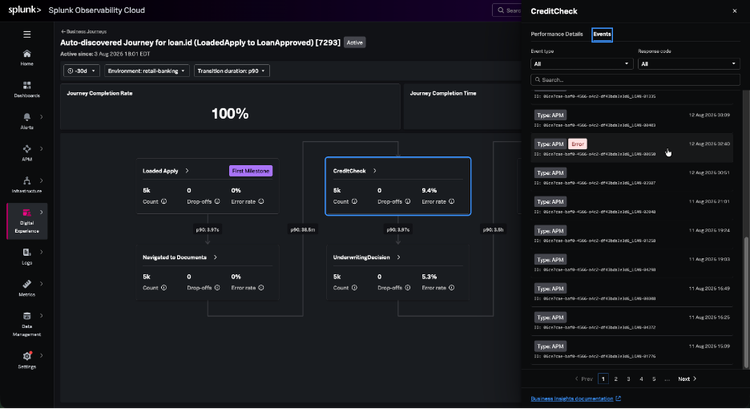
Figure 3: Seamless pivot from a delayed business milestone directly into correlated APM distributed traces and RUM user sessions, revealing a third-party KYC API timeout as the technical root cause.
- Direct Telemetry Pivoting: SREs, developers, and AI agents can inspect the exact spans, database queries, and downstream microservices tied to a stalled customer journey.
- Frontend User Context: Correlate backend milestones and errors directly with real user sessions in RUM to understand customer-facing impact.
- Impact-Driven Prioritization: Triage engineering fixes based on the financial and operational severity of the impacted business process rather than sheer alert volume.
Built on the Cisco Data Fabric Powered by Splunk
Business Journeys is a core pillar of our full-stack observability strategy. Built natively on top of the Cisco Data Fabric powered by Splunk, you gain complete visibility across infrastructure, network paths via Cisco ThousandEyes, and the unified capabilities of Splunk Observability Cloud—including application services in Splunk APM, user experiences in Digital Experience Analytics, and business outcomes in Business Journeys.
Related Articles

Staff Picks for Splunk Security Reading January 2023

Cracking Braodo Stealer: Analyzing Python Malware and Its Obfuscated Loader