Splunk and Astronomy, Part 2
Global Impact Nimish DoshiI recently attended a series of fascinating short lectures, given in layman’s terms for the average audience, conducted by Astronomer Andy Green from Stardome (based in the UK). The topics that were covered included lunar landings, star formation, and planetary impacts. It is the last topic that I would like to discuss here. Andy presented a history of terrestrial and extra-terrestrial impacts for things like when an asteroid or a comet strikes a heavenly body. The most interesting heavenly body is, of course, the Earth itself. Today, there are a handful of organizations that track Near Earth Objects (NEO) and the log files that they collect can be indexed by Splunk. In the past I have already mentioned one use case for collecting astrometry logs, but this one to collect data from NEO may be more important. What I will do is present a hypothetical use case to present how Splunk can be used to analyze this data using fictional names and numbers for illustrative purposes.
Collecting Data
We can assume that an organization is collecting data on NEO several times a day and this data can be made available in a time series manner using any unstructured text format that may be required. A light Splunk forwarder can be placed on machines generating the log files and the data can be sent to a central Splunk indexer. The indexer will assign the data a sourcetype, which can be used to set knowledge properties on the data such as field extractions. We’ll call this sourcetype NEO. Each event will have somewhere in the data, a timestamp for the when the event occurred, the name for the NEO, its orientation with respect to the Earth, and its distance from the Earth. For instance:
Dec 29, 2010 name=m2343 500500 miles from earth; Southern Hemisphere; comment: too small and far out to care
All of these fields can be extracted at search time in Splunk when needed.
Reporting with a Time Chart
The first question that people may ask is that in the last week what NEO were less than 1 million miles from Earth and what was their average distance from Earth?
With the data in hand, I can run a Splunk search such as:
sourcetype=NEO distance<1000000 earliest=-7d | eval normalize=round(distance/100) | timechart span=1d avg(normalize) as AverageDistance by name
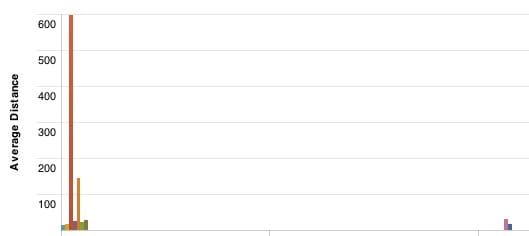
Average Distance From Earth
What this search does is plot out the average distance per day for each NEO that was less than 1 million miles from the Earth in a one week period. I divided the result by 100 to make it easier to read smaller numbers on the graph. The NEO which are closer in distance to the Earth may require more urgency to monitor. More filters and charts can be developed using the data at hand to place on a Splunk dashboard.
Including Other Metrics
Just because a NEO is close to the Earth doesn’t mean that we need to start worrying about it. Other metrics such as the size of the object in feet, its speed in miles/hour, composition, and likelihood of impact would also need to be considered. The likelihood of impact is based on trajectory analysis, but the other characteristics are rather static and could reside in an external database or CSV file. With Splunk, one can do static (CSV files) or dynamic (call an external API via a Python script) lookups to gather this data to place in a tabular report. For instance, if the external characteristics of the NEO are in a database and I have already written the Python script to gather this data, I can use the following search to print out a table for these values. I’ve presented the search results from the command line to show a contrast with a browser search
sourcetype=NEO distance<1000000|dedup name|lookup getCharacteristics name OUTPUT size, speed, composition|table name, distance, size, speed, composition
name distance size speed composition ------ --------- ---- ----- --------------- m2343 500500 11 32000 rock c341 150000 100 40000 ice a4347 100010 255 30000 iron
…
As can be seen, if we enrich our results with this external data, we can see that some objects such as m2343 may be too small to be a risk on impact as they probably will burn up in the Earth’s atmosphere.
What If Analysis
Let’s make up an artificial construct for the sake of discussion called risk of impact which is equal to the size of the object multiplied by its speed. (Note that this is very artificial as the size of the object and its composition matters greatly and the speed of the object is usually tens of thousands of miles per hour, but I am just trying to show another statistic using Splunk.) Let’s say if the “risk of impact” number is less than 400,000, the risk is low. If the number is greater than 400,000 but less than 2,000,000, the risk is medium. All other values greater than 2,000,000 would be considered high. In Splunk terms, this search could be devised as:
sourcetype=NEO distance<1000000|dedup name|lookup getCharacteristics name OUTPUT size, speed|eval risk=size*speed | rangemap field=risk low=0-400000 medium=400001-1000000 default=high|table name, range
name range ------ ---------- m2343 low c341 high a4347 high ...
We know the size and the composition of the NEO will not change, but the what-if analysis can produce different risks if we change the the speed in the database and rerun the same search. What this gives us is an idea on how to lower the risk of an impact. However, changing the speed, momentum, and ultimately the direction of large NEO is a technological challenge that needs to be met in the coming decades.
Using Splunk to Present Metrics
If organizations that collect this NEO data can place it online via Splunk like dashboards, it will give people up to date information on what close, large objects are floating about in space. (For the sake of completeness, objects that are relatively faraway, but have a chance to impact the Earth are equally as important to track.) Of course, the chance of collision, is the most important metric, which also needs to be shown with each chart. By having this information readily graphed, available, and updated, it may raise awareness for an issue that has always been put on the back burner. This may lead to more demands and support for research on how to deflect away the risk of a catastrophic impact.