Observability
Splunk Real User Monitoring (RUM)
Pinpoint issues that impact customers with end-to-end visibility from browser or mobile app to backend services.

Accelerate troubleshooting with complete context
As part of Observability Cloud and with built-in capabilities like Session Replay, Splunk RUM provides you with all the context you need from the frontend to the backend to quickly identify the root cause of any issue.
Optimize before failure
Understand user experience on apps and webpages so you can resolve issues while they are still small.
Control your data
Take advantage of an OpenTelemetry-native solution that lets you instrument once and send your data anywhere with no vendor lock-in.
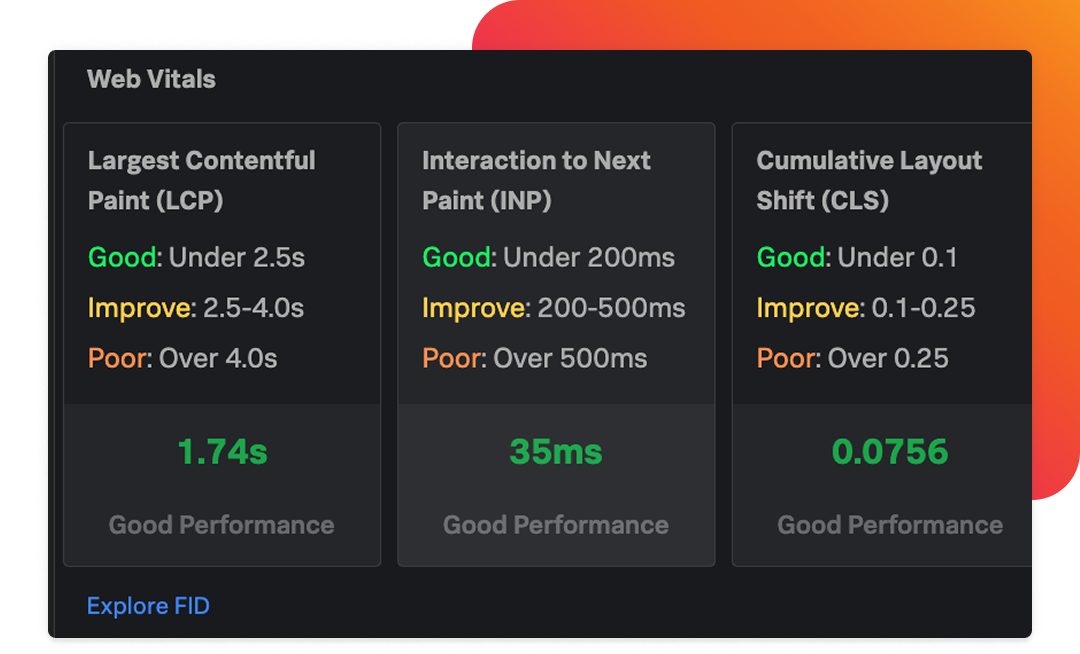
Improve core web vitals
Benchmark and improve your customer experience with core web vitals as the standard for page load, interactivity, and visual stability.
Features
Full transaction analysis for your web and mobile experience
Pinpoint user-facing issues anywhere in your stack — from web browsers and native mobile apps to backend services.
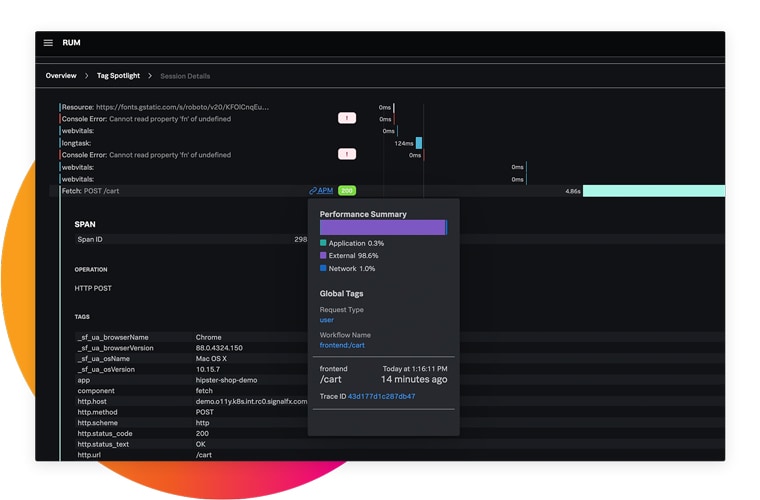
Complete end-to-end visibility
Optimize user experience by easily tracing every frontend transaction to its backend services.
Custom events
Easily create new metrics to track important user behaviors across web pages and apps.
Deep visibility for iOS, Android, and hybrid apps
Auto-capture common client attributes, app lifecycle events, network requests and errors, app errors, and crashes for native and hybrid mobile apps.
Framework-agnostic instrumentation
Easily instrument multipage and single-page apps to capture transactions and route changes across every framework.
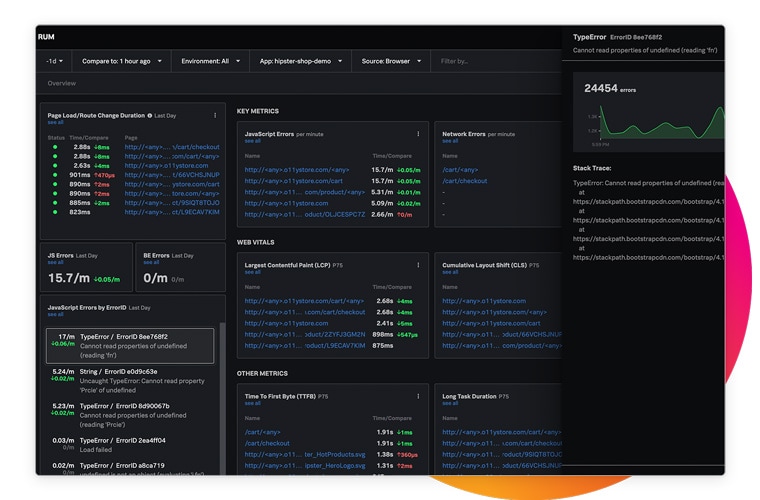
Full user session analysis
Measure the customer impact of every resource, image, route change, and API call, with complete visibility across every user session.
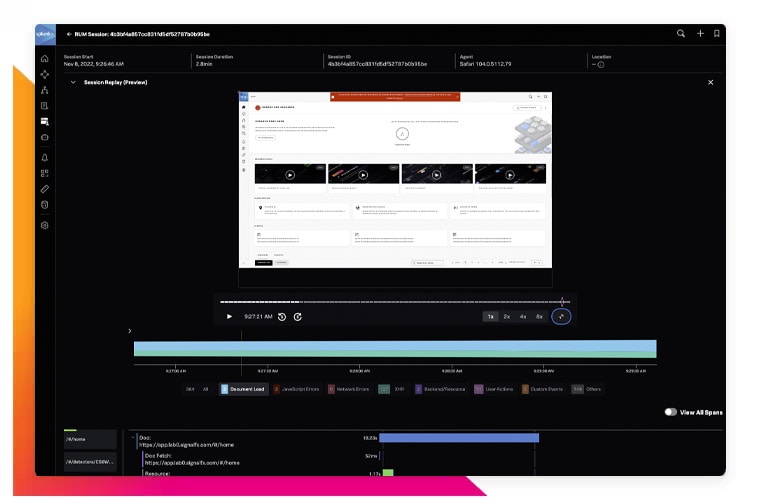
Session replay
React to issues more efficiently with video reconstructions correlated with session waterfall to quickly reproduce issues.

Are you a current Observability Cloud customer looking for learning resources?
Check out our Observability Learning Path on Splunk Community, with curated content organized by skill level.

CUSTOMER STORY
Rappi Fixes Issues 90% Faster While Handling a 300% Surge in On-Demand Orders
We’re all attuned to the potential business impact of downtime, so we’re grateful that Splunk Observability helps us be proactive about reliability and resilience with end-to-end visibility into our environment.
90%+
faster MTTR thanks to real-time visibility with Splunk’s observability products
300%
growth managed with real-time monitoring during the pandemic


Application Performance Monitoring
Solve problems faster in monoliths and microservices by immediately detecting problems from new changes, confidently troubleshooting the source of an issue, and optimizing service performance.
Logs in Observability
Log analysis across your cloud-native application and cloud environments.
Synthetic Monitoring
Go beyond basic uptime and performance monitoring for better digital experiences.
Infrastructure Monitoring
The only real-time, analytics-driven multicloud monitoring solution for all environments.
Splunk AppDynamics
Observe and secure your hybrid and on-prem applications across every environment.
Business and IT Service Monitoring
Protect service-level agreements and monitor service health with intelligent event management and ITSM integrations.