
Digital Resilience Pays Off
How resilient is your organization? Learn how to mature your digital resilience with this free guide.

Hopefully by now you have had an opportunity to take actions to mitigate the vulnerabilities that Microsoft announced last week pertaining to Microsoft Exchange. In case you are just catching up, that’s alright, here is our initial blog to help you detect the Microsoft Exchange Zero-Day Activity. Go ahead and have a read, we will wait.
Wait, you say you’ve read the blog but need more information on these Microsoft Exchange vulnerabilities and additional detections? Ok, here is a quick summary of what happened and where we are.
Last Tuesday on March 2nd, Microsoft released a series of patches and followed this announcement up with additional mitigation steps to address a set of vulnerabilities in their Microsoft Exchange mail server. These patches address the following vulnerabilities: CVE-2021-26855, CVE-2021-26857, CVE-2021-26858, and CVE-2021-27065. Volexity published their blog that same day, detailing the vulnerability as well as the attacks they observed. Since then, Volexity have updated their blog to note that exploitation of the initial vulnerability was observed as early as January 3rd of this year.
For the purpose of understanding how early the window of exposure was opened, this new date should now be factored into your investigation. We have also found several publicly available proof-of-concept exploits, and expect there to be an increase in organizations being targeted with these vulnerabilities. The number of vulnerable Microsoft Exchange servers we’ve identified, according to scans conducted from Shodan, is over 92,000 servers.
 Thanks to @hrbrmstr and @TomSellers, for the graphical representation of the percentage of still-vulnerable Exchange servers, per country. Go New Zealand!
Hopefully, you don’t own any of the Exchange servers shown in orange – because you have already patched. From there, you are likely in one of these situations:
Either way, you are looking to understand potential next steps. We are here to help!
For the latter group, who did find something, activating your incident response plan and taking steps to contain, eradicate and remediate the threat is especially important. Monitoring for new account creations, signs of lateral movement, credential harvesting and exfiltration are important as well.
The former group, despite not finding anything, you should not assume that all is well. Additional vigilance is required!
By the way, we’ve heard from some customers that they may not even know the extent of their exposure because they don’t know if they have Internet-facing OWA servers. Here’s where we recommend working with one of our alliance partners like RiskIQ to scan your public-facing address space — both the space you know about and the space you may not – to find potentially vulnerable Exchange instances. A number of nmap scripts are also out there, some developed in the community and others by Microsoft, so this could also be another option, if you choose.
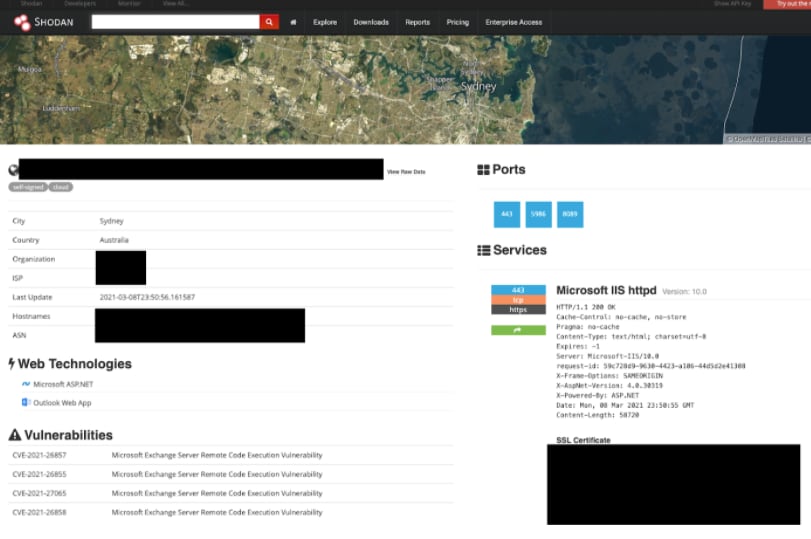
Understanding if your OWA servers are internet facing is important, crawlers and scanners are continually being run, so wishing this away is not a good strategy. In fact, we stood up an Exchange server to test our detections and it was quickly identified. You can see a screen capture of it from Shodan here:
One of the things we called out in the earlier blog, Detecting HAFNIUM Exchange Server Zero-Day Activity in Splunk, was to ensure you’re consuming the right Exchange operational and security logs using the Splunk Universal Forwarder — specifically the HttpProxy logs. Unless you add a crcSalt directive in your inputs.conf, you may not ingest all of the logs you are expecting because of the very large nature of the CSV header in the files. See below for a working monitor stanza that could be used in inputs.conf on the Universal Forwarder.
[monitor://C:\Program Files\Microsoft\Exchange Server\V15\Logging\HttpProxy\]
disabled = false
crcSalt = <SOURCE>
sourcetype=ms:exchange:http_proxy
We noticed that when we ingested these HttpProxy logs, sometimes there were spurious newlines in them, and this could cause certain events to be garbled upon ingest. However, if your HttpProxy logs look clean, then you can use Splunk’s Indexed Extractions feature to automatically ingest these csv-formatted log files and automatically parse the header fields.
If you choose to use Indexed Extractions because your logs are clean with no spurious newlines, the following stanza should be included in props.conf on both the Universal Forwarder and the Search Head:
[ms:exchange:http_proxy]
CHARSET=UTF-8
INDEXED_EXTRACTIONS=csv
FIELD_DELIMITER=,
KV_MODE=none
SHOULD_LINEMERGE=false
disabled=false
TIMESTAMP_FIELDS=DateTime
However, if you’re seeing occasional errors relating to timestamp recognition with the above config, we have a working alternative. The inputs.conf on the Universal Forwarder remains the same. But on the Indexer, we want to “nullQueue” the headers at the top of each file, and we want to tell Splunk to index the data and merge together the data regardless of the extra newlines. It’s pretty cool that Splunk can handle this! The following config would go in the props.conf on your Indexers (and restart to get this functional):
[ms:exchange:http_proxy]
TRANSFORMS-killheader1 = kh1
SHOULD_LINEMERGE=true
LINE_BREAKER=([\r\n]+)\d{4}\-\d{2}\-\d{2}T
NO_BINARY_CHECK=true
Then, a corresponding transforms.conf on your indexers, too:
[kh1]
REGEX = ^DateTime
DEST_KEY = queue
FORMAT = nullQueue
We also need to tell our Search Head how to extract the fields. So you place this in the props.conf on your Search Head:
[ms:exchange:http_proxy]
REPORT-extractfields = extractfields
Finally, a corresponding transforms.conf on your Search Head:
[extractfields]
DELIMS=","
FIELDS=DateTime,RequestId,MajorVersion,MinorVersion,BuildVersion,RevisionVersion,ClientRequestId,Protocol,UrlHost,UrlStem,ProtocolAction,AuthenticationType,IsAuthenticated,AuthenticatedUser,Organization,AnchorMailbox,UserAgent,ClientIpAddress,ServerHostName,HttpStatus,BackEndStatus,ErrorCode,Method,ProxyAction,TargetServer,TargetServerVersion,RoutingType,RoutingHint,BackEndCookie,ServerLocatorHost,ServerLocatorLatency,RequestBytes,ResponseBytes,TargetOutstandingRequests,AuthModulePerfContext,HttpPipelineLatency,CalculateTargetBackEndLatency,GlsLatencyBreakup,TotalGlsLatency,AccountForestLatencyBreakup,TotalAccountForestLatency,ResourceForestLatencyBreakup,TotalResourceForestLatency,ADLatency,SharedCacheLatencyBreakup,TotalSharedCacheLatency,ActivityContextLifeTime,ModuleToHandlerSwitchingLatency,ClientReqStreamLatency,BackendReqInitLatency,BackendReqStreamLatency,BackendProcessingLatency,BackendRespInitLatency,BackendRespStreamLatency,ClientRespStreamLatency,KerberosAuthHeaderLatency,HandlerCompletionLatency,RequestHandlerLatency,HandlerToModuleSwitchingLatency,ProxyTime,CoreLatency,RoutingLatency,HttpProxyOverhead,TotalRequestTime,RouteRefresherLatency,UrlQuery,BackEndGenericInfo,GenericInfo,GenericErrors,EdgeTraceId,DatabaseGuid,UserADObjectGuid,PartitionEndpointLookupLatency,RoutingStatus
Restart your indexers so that the nullQueue statements work, and you should be error-free as you index the HttpProxy logs AND you’ll have all of your fields extracted!
The initial Microsoft threat blog associated this attack with the threat actor they refer to as HAFNIUM, but it is important to note that with the public disclosure of the vulnerability, it is highly likely that other threat actors are exploiting these vulnerabilities for their own purposes.
In fact, Red Canary’s blog earlier this week identified different activities exploiting this same set of vulnerabilities. The TTPs of other threat actors may be different than HAFNIUM which means there may be additional techniques observed that end up being linked to this vulnerability as the initial infection vector. Our point is that if you had these vulnerabilities and were compromised, it doesn’t mean that HAFNIUM compromised you, so broader efforts looking for credential harvesting, lateral movement and other tactics may be called for beyond the HAFNIUM indicators. We don’t mean to alarm you, but once an actor can leverage this vulnerability to gain a foothold with local SYSTEM administrator privileges, anything is possible.
Since we posted our initial blog, CISA has released an emergency directive as well as an IOC detection tool. CISA’s last emergency directive was around the SolarWinds attack, which should give you a good idea of how crucial it is to ensure that your Exchange servers are patched as soon as possible.
If you are looking for a deeper dive into the specifics of the vulnerabilities that are being exploited, Praetorian has created this excellent blog.
For those looking for indicators, Microsoft has updated their original reporting with GitHub links to malware hashes and known malicious file paths in csv and json format.
We continue to recommend logging in Splunk endpoint data sources to provide the most fidelity around actions taking place on hosts. This can be via Microsoft Windows Event Logs (especially the Security log) or Microsoft Sysmon. EDR solutions are also good, but understanding the process execution that is occurring on the endpoint is crucial - so start collecting those Event Code 4688 or Event Code 1 events!
Microsoft Exchange events, as detailed previously are important for this specific set of vulnerabilities.
Network data sources, such as firewall, VPN and web application firewall (WAF) can be useful to monitor for communication inbound to the OWA portion of the Exchange server depending on the configuration of your network. For post breach identification of lateral movement or exfiltration, network data sources as well as wire data, like Stream for Splunk or Zeek can play a role in understanding north/south and east/west communications.
The Splunk Threat Research team released an Analytic Story called “HAFNIUM group” via Enterprise Security Content Update version 3.16 on March 8th to provide visibility into these adversary actions. While you don’t need to have Splunk Enterprise Security (ES) to take advantage of ESCU, if you have ES, the Analytic Story can help accelerate your deployment in setting up the detections. Below is a listing of these detections with their associated ATT&CK technique and HAFNIUM activity.
ATT&CK Technique | Title | HAFNIUM activity | Splunk Searches |
T1003.001 | OS Credential Dumping: LSASS Memory | Used Procdump to export LSASS | |
T1059.001 | Command and Scripting Interpreter: PowerShell | Nishang PowerShell | Malicious PowerShell Process - Connect To Internet With Hidden Window Attempt To Set Default PowerShell Execution Policy To Unrestricted or Bypass |
T1114.001 | Email Collection: Local Email Collection | PowerShell mailbox collection | |
T1136 | Create Account | Add user accounts | |
T1003.003 | OS Credential Dumping: NTDS | Steal copies of the Active Directory database (NTDS.DIT) | |
T1021.002 | Remote Services: SMB/Windows Admin Shares | Lateral movement | |
T1505.003 | Server Software Component: Web Shell | W3WP.exe Spawning Shell | |
T1190 | Exploit Public-Facing Application | UMService.exe umworkerprocess.exe spawning a child process | |
T1505.003 | Server Software Component: Web Shell | W3WP.exe writing .aspx files |
The searches in this analytic story are pertinent to the initial Exchange Vulnerability as well as additional actions that would occur post compromise including the dumping of LSASS, the use of Nishang Powershell one-liners and much more that are incredibly helpful for monitoring for activity that other actors might use as well.
Many of the searches in the ESCU above contain highly scalable, accelerated data model searches that use the tstats command. While some searches are written in SPL, we recognize that not all of them are and so we wanted to provide these searches in SPL for rapid testing and deployment so all Splunk users can take advantage of them. Please note, since they are best effort with data available and using some tip-of-spear data input. Your mileage may vary compared to tested detections like in ESCU.
The following searches are written in SPL and utilize Windows Event Logs and/or Microsoft Sysmon as the primary data source (first a Sysmon example where applicable, then the Security event log). We realize that not everyone may have these data sources in their environment and other endpoint technologies may be deployed, but these searches can be adapted for your environment. A friendly reminder; if you are looking for process execution with Windows Event Logs, make sure that 4688 command line auditing is turned on. Otherwise the Process_Command_Line field won’t be there!
This search is based on the ms:exchange:http_proxy sourcetype that we defined earlier. It picks up the reset of the OAB Virtual Directory, which is called out in the Praetorian blog. This is where details of the Exchange server are written, which allow the web shell exploit to take place.
index=* sourcetype=ms:exchange:http_proxy Method=POST HttpStatus=200
| search ResetOABVirtualDirectory
| table  _time, ClientIpAddress, UrlStem, IsAuthenticated, Method, Protocol, HttpStatus, AnchorMailbox
If you return any matches from the search above, you will want to do some additional investigation around file creation. If you are collecting Microsoft Sysmon, the following search should return events that have been written to the vulnerable directory. The S-1-5-18 user ID is the local system account which is used by the exploit to write the file.
index=* source="xmlwineventlog:microsoft-windows-sysmon/operational"
UserID="'S-1-5-18'" EventCode=11
file_path="C:\\Program Files\\Microsoft\\Exchange Server\\V15\\FrontEnd\\HttpProxy\\owa\\auth\\*"
Similarly, if you have your GPO set to log event code 4663, the following search of Windows Event Logs would be something to execute as well.
index=* source="WinEventLog:Security" EventCode=4663 AccessList="%%4417"
ObjectName="C:\\Program Files\\Microsoft\\Exchange Server\\V15\\FrontEnd\\HttpProxy\\owa\\auth\\*"
| table _time host ObjectName ProcessName Computer Caller_User_Name
The following searches are derived from the ESCU HAFNIUM Analytic Story that the Threat Research team created. Special thanks to them for building these out and their efforts! The first two searches are focused on behaviors that are indicative of the Exchange vulnerability being exploited.
This detection identifies Microsoft Exchange Server's Unified Messaging services, umworkerprocess.exe and umservice.exe, spawning a child process, indicating possible exploitation of CVE-2021-26857 vulnerability.
index=* (sourcetype=XmlWinEventLog:Microsoft-Windows-Sysmon/Operational OR
source=XmlWinEventLog:Microsoft-Windows-Sysmon/Operational) EventCode=1
ParentImage=*\\umworkerprocess.exe OR ParentImage=*\\UMService.exe (Image!=*\\wermgr.exe OR Image!=*\\werfault.exe)
index=* source="WinEventLog:Security"
EventCode=4688 Creator_Process_Name=*\\umworkerprocess.exe OR
Creator_Process_Name=*\\UMService.exe (New_Process_Name!=*\\wermgr.exe OR New_Process_Name!=*\\werfault.exe)
This query identifies a shell, PowerShell.exe or Cmd.exe, spawning from W3WP.exe, or IIS.
index=* (sourcetype=XmlWinEventLog:Microsoft-Windows-Sysmon/Operational OR
source=XmlWinEventLog:Microsoft-Windows-Sysmon/Operational) EventCode=1 ParentImage=*\\w3wp.exe
(Image=*\\cmd.exe OR Image=*\\powershell.exe)
index=* source="WinEventLog:Security" EventCode=4688
Creator_Process_Name=*\\w3wp.exe (New_Process_Name=*\\cmd.exe OR
New_Process_Name=*\\powershell.exe)
These remaining searches below are likely to be seen post-exploitation and are good searches to utilize to identify additional activities by the adversary. It is important to point out that for other adversaries exploiting these vulnerabilities, other techniques may be used as well so do not consider this set of searches to be exhaustive.
index=* (sourcetype=XmlWinEventLog:Microsoft-Windows-Sysmon/Operational OR
source=XmlWinEventLog:Microsoft-Windows-Sysmon/Operational)
EventCode=1 (Image=*\\powershell.exe OR Image=*\\pwsh.exe OR Image=*\\PowerShell_ISE.exe) CommandLine=*.DownloadString*
index=* source="WinEventLog:Security" EventCode=4688 (New_Process_Name=*\\powershell.exe OR
New_Process_Name=*\\pwsh.exe OR New_Process_Name=*\\PowerShell_ISE.exe) Process_Command_Line
=*.DownloadString*
index=* sourcetype="WinEventLog" source="WinEventLog:Security"
EventCode=4720 OR (EventCode=4732 Group_Name=Administrators) | transaction member_id connected=false maxspan=180m
index=* (sourcetype=XmlWinEventLog:Microsoft-Windows-Sysmon/Operational OR
source=XmlWinEventLog:Microsoft-Windows-Sysmon/Operational) EventCode=1
CommandLine=*psexec*accepteula*
index=* source="WinEventLog:Security" EventCode=4688 Process_Command_Line
=*psexec*accepteula*
index=* (sourcetype=XmlWinEventLog:Microsoft-Windows-Sysmon/Operational OR
source=XmlWinEventLog:Microsoft-Windows-Sysmon/Operational) EventCode=1
Image=*\\rundll32.exe CommandLine=*comsvcs.dll* CommandLine=*MiniDump*
index=* source="WinEventLog:Security" EventCode=4688 New_Process_Name=*\\rundll32.exe Process_Command_Line
=*comsvcs.dll* Process_Command_Line=*MiniDump*
index=* (sourcetype=XmlWinEventLog:Microsoft-Windows-Sysmon/Operational OR source=XmlWinEventLog:Microsoft-Windows-Sysmon/Operational) EventCode=1
(Image=*\\procdump.exe OR Image=*\\procdump64.exe) (CommandLine=*-ma* OR CommandLine=*-mm*) CommandLine=*lsass*
index=* source="WinEventLog:Security" EventCode=4688
(New_Process_Name=*\\procdump.exe OR New_Process_Name=*\\procdump64.exe)
(Process_Command_Line=*-ma* OR Process_Command_Line=*-mm*) Process_Command_Line=*lsass*
index=* (sourcetype=XmlWinEventLog:Microsoft-Windows-Sysmon/Operational OR
source=XmlWinEventLog:Microsoft-Windows-Sysmon/Operational) EventCode=1
Image=*\\powershell.exe CommandLine=*-WindowStyle* CommandLine=*hidden* CommandLine="*New-Object*"
index=* source="WinEventLog:Security"
EventCode=4688 New_Process_Name=*\\powershell.exe Process_Command_Line=*-WindowStyle* Process_Command_Line=*hidden* Process_Command_Line="*New-Object*"
index=* (sourcetype=XmlWinEventLog:Microsoft-Windows-Sysmon/Operational OR
source=XmlWinEventLog:Microsoft-Windows-Sysmon/Operational) EventCode=1 Image=*\\powershell.exe
(CommandLine="* -ex*" OR CommandLine="* bypass *")
index=* source="WinEventLog:Security" EventCode=4688
New_Process_Name=*\\powershell.exe (Process_Command_Line="* -ex*" OR Process_Command_Line="* bypass *")
index=* (sourcetype=XmlWinEventLog:Microsoft-Windows-Sysmon/Operational OR
source=XmlWinEventLog:Microsoft-Windows-Sysmon/Operational) EventCode=1
(Image=*\\powershell.exe OR Image=*\\pwsh.exe OR Image=*\\PowerShell_ISE.exe) (CommandLine=*Net.Sockets.TCPClient* AND CommandLine=*System.Text.ASCIIEncoding*)
index=* source="WinEventLog:Security" EventCode=4688 (New_Process_Name=*\\powershell.exe OR
New_Process_Name=*\\pwsh.exe OR New_Process_Name=*\\PowerShell_ISE.exe
(Process_Command_Line=*Net.Sockets.TCPClient* AND
Process_Command_Line=*System.Text.ASCIIEncoding*)
index=* (sourcetype=XmlWinEventLog:Microsoft-Windows-Sysmon/Operational OR
source=XmlWinEventLog:Microsoft-Windows-Sysmon/Operational) EventCode=1
Image=*\\ntdsutil.exe CommandLine=*ntds* CommandLine=*create*
index=* source="WinEventLog:Security" EventCode=4688 New_Process_Name=*\\ntdsutil.exe
Process_Command_Line=*ntds* Process_Command_Line=*create*
Even if you haven’t uncovered any malicious behavior, it is important to continue monitoring, particularly as more actors look to leverage these vulnerabilities for their own purposes.
The Microsoft Exchange team has posted hashes for known good files that are part of their build as well as scripts to run against Exchange. John Lambert from MSTIC tweeted this out earlier this week. If you are trying to determine if all of the files that make up your Exchange server are authentic, you may want to consider doing some file integrity monitoring by leveraging this listing.
We will continue to keep an eye on all of this and will continue to provide updates as more is uncovered. It is important that even if you were slow to patch the initial Exchange vulnerability, all is not lost. However, it is crucial to hunt for post exploitation behavior. This kind of behavior is really something that should be monitored for continuously, so build once and use it many times to detect adversary actions.
As always, security at Splunk is a family business. Credit to authors and collaborators:
----------------------------------------------------
Thanks!
John Stoner

The world’s leading organizations rely on Splunk, a Cisco company, to continuously strengthen digital resilience with our unified security and observability platform, powered by industry-leading AI.
Our customers trust Splunk’s award-winning security and observability solutions to secure and improve the reliability of their complex digital environments, at any scale.

Get the latest articles from Splunk straight to your inbox.
© 2005 - 2025 Splunk LLC All rights reserved.