Monitor Google Cloud Functions in Real-Time with Splunk Infrastructure Monitoring

We have seen interest and adoption of serverless architectures pick up immensely following our first serverless monitoring solution for AWS Lambda. Since then we have added support for Microsoft Azure Functions by providing pre-built dashboards for critical function metrics and performance data. Our customers have taken advantage of the unique ability to monitor Lambda and Azure functions at 1-second resolution with Splunk Infrastructure Monitoring Function Wrappers. We are excited to extend function wrappers to our GCP customer, so they too can realize the same real-time monitoring capabilities.
Comprehensive Support for Serverless Functions with Splunk Infrastructure Monitoring
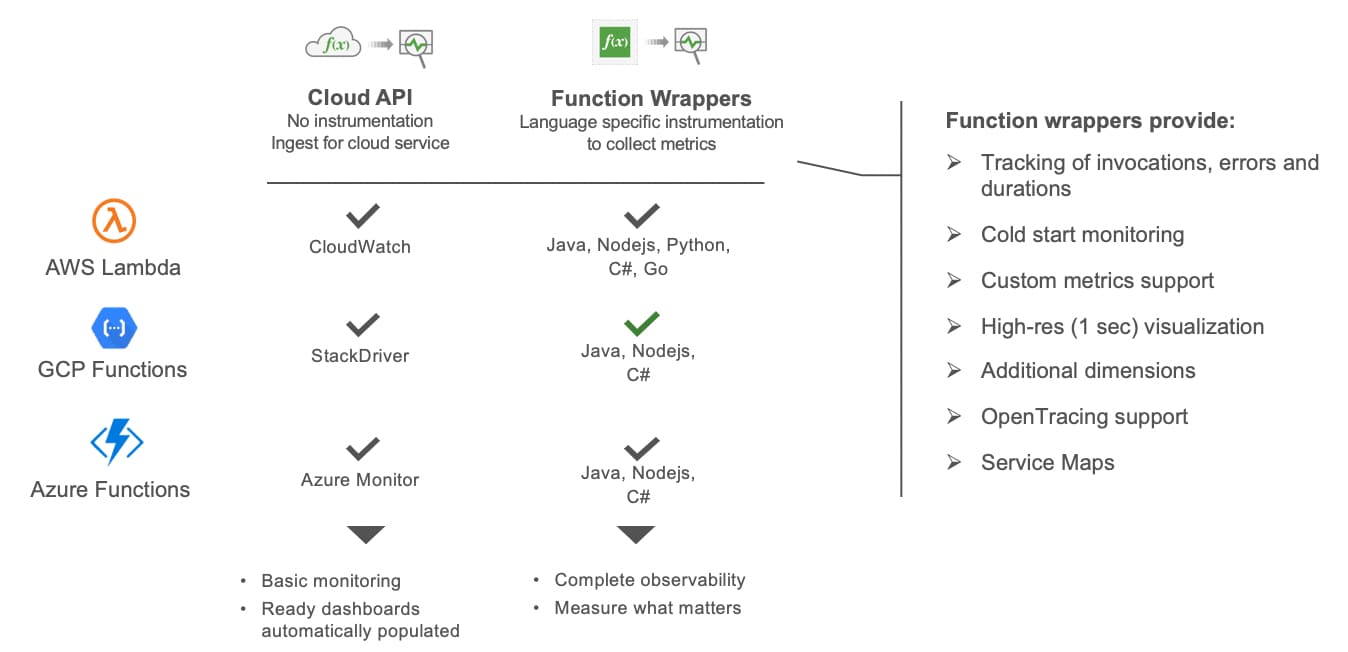
As mentioned, Google Cloud Function Wrappers are just a piece of our overall support for the serverless ecosystem. By providing direct cloud API integrations for the most popular cloud providers, Splunk Infrastructure Monitoring enables basic monitoring of function metrics with access to pre-built serverless dashboards for AWS Lambda, GCP Functions, and Azure Functions.
For situations when you need to track function invocations or errors at a level more granular than the standard cloud api integration can deliver, this is where function wrappers come in handy. They include calls to Splunk Infrastructure Monitoring with the count of invocations and errors, the execution duration, and whether the functions being called are being impacted by a cold start. The wrappers also provide an easy mechanism to instrument your code for custom metrics that matter to you.
Let’s dive into how customers can utilize Splunk for Google Cloud Function monitoring.
Integration with Google StackDriver
Much like our capabilities for monitoring Lambda or Azure Functions, when using the standard cloud api integration for Google Cloud, StackDriver metrics provide customers with an Infrastructure Navigator and several built-in dashboards. The metrics for these dashboards are sent in automatically to Splunk if you are syncing with StackDriver.
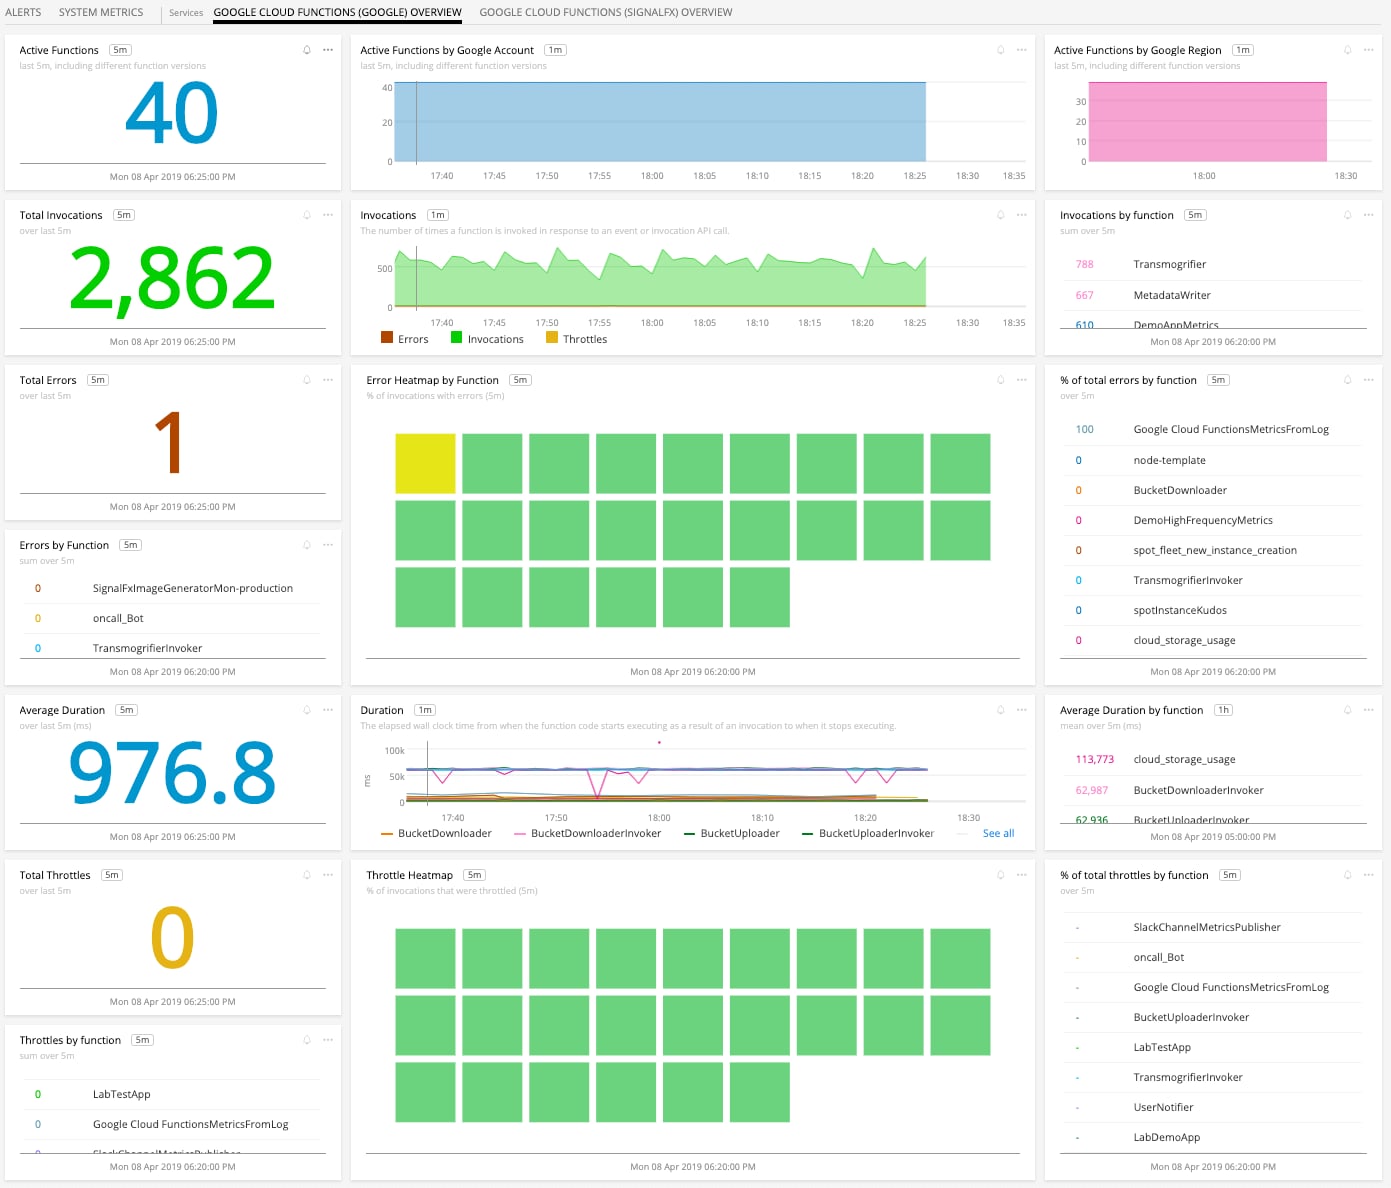
As with all other services that Infrastructure Navigator visualizes, we give you advanced filtering capabilities for drilling down to the subset of functions you are interested in, grouping them using a variety of standard dimensions including custom GCP tags that you’ve applied, and changing the time span that you are looking at.
When you select the Cloud Function tab in Splunk Infrastructure Monitoring you see a summary dashboard. Not only does this provide point-in-time information about the current state of your functions, but it also shows you trends, so you can see a breakdown of functions by account and by region, number of invocations, and even errors by function.
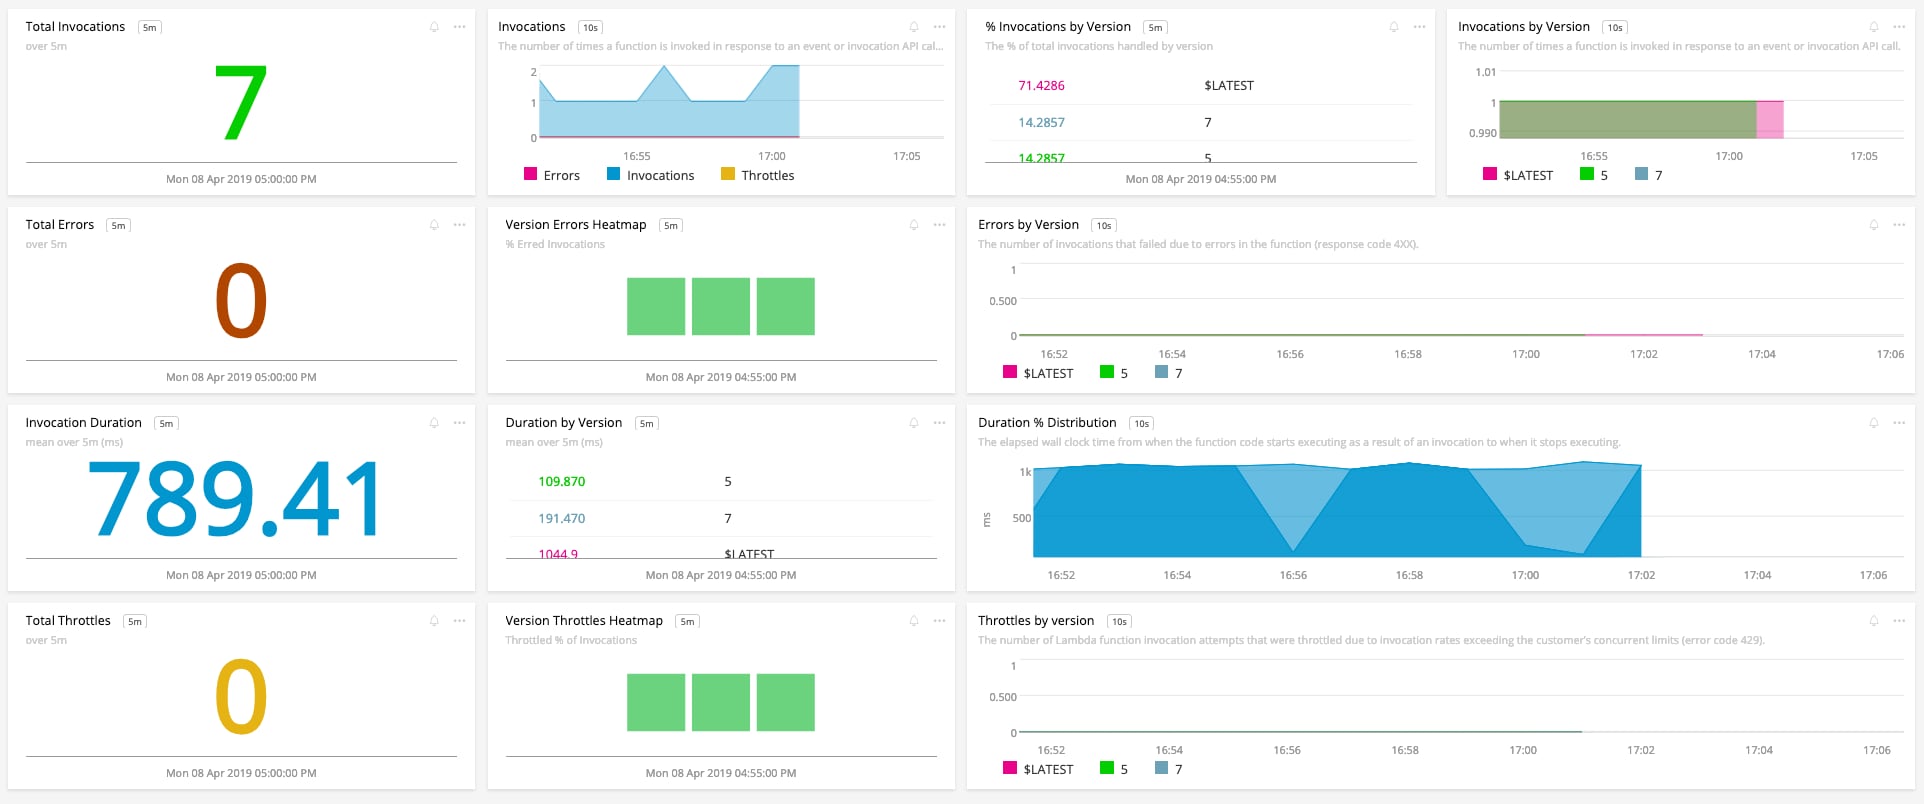
When you select a particular function, we’ll drill down to a dashboard about that specific function.
Splunk Infrastructure Monitoring Function Wrappers for Google Cloud
As useful as the basic metrics provided by StackDriver can be, there are often times when you need to capture details about invocations or errors in a more timely, more granular fashion than the standard 1 minute resolution that StackDriver provides. To address this we’ve built wrappers specifically for Google Cloud Functions.
In conjunction with the rest of your Google Cloud environment, you now have the ability to correlate all of your Google Cloud resources with your Google Cloud Function metrics at high resolution (1-second). Furthermore, if you are using multiple cloud providers or even on-premises services, you can consolidate all of these metrics within Splunk Infrastructure Monitoring for a true single pane of glass experience.
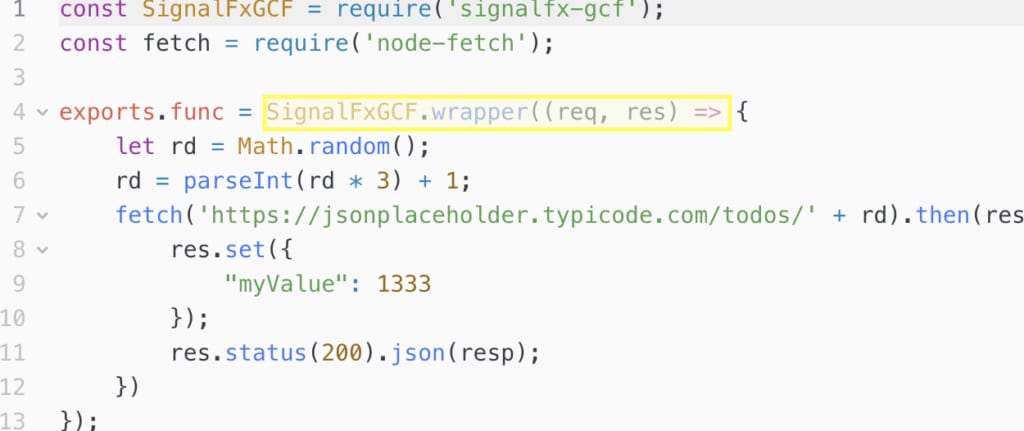
We currently have wrapper code in multiple languages for your Google Cloud Functions including Node.js, Go, and Python. Below is an example of using a function wrapper for Node.js.
Measure the Serverless Metrics That Matter
With just a few lines of extra code Splunk Infrastructure Monitoring Function Wrappers enable you to send the custom metrics above and beyond the standard Google Cloud Function metrics you can get via our Google Cloud API integration. Customers often send custom metrics that are relevant to how functions are supporting their business, including user requests, checkout abandonment, revenue per location, etc.
Tracing Google Cloud Functions
Beyond gathering the important metrics from your cloud functions you can also trace your functions with Splunk. With the Splunk Infrastructure Monitoring Wrappers you can send OpenTracing compliant spans directly to Splunk from your Python and Ruby applications (more language support will continue to be added) just as easily as sending custom metrics.
By sending OpenTracing compliant spans via the Function Wrappers, Splunk provides you with granular visibility into the performance of your serverless applications. With some simple instrumentation of your functions you’ll get end-to-end transaction views into invocations of multiple functions and your services.
All the Usual Splunk Benefits
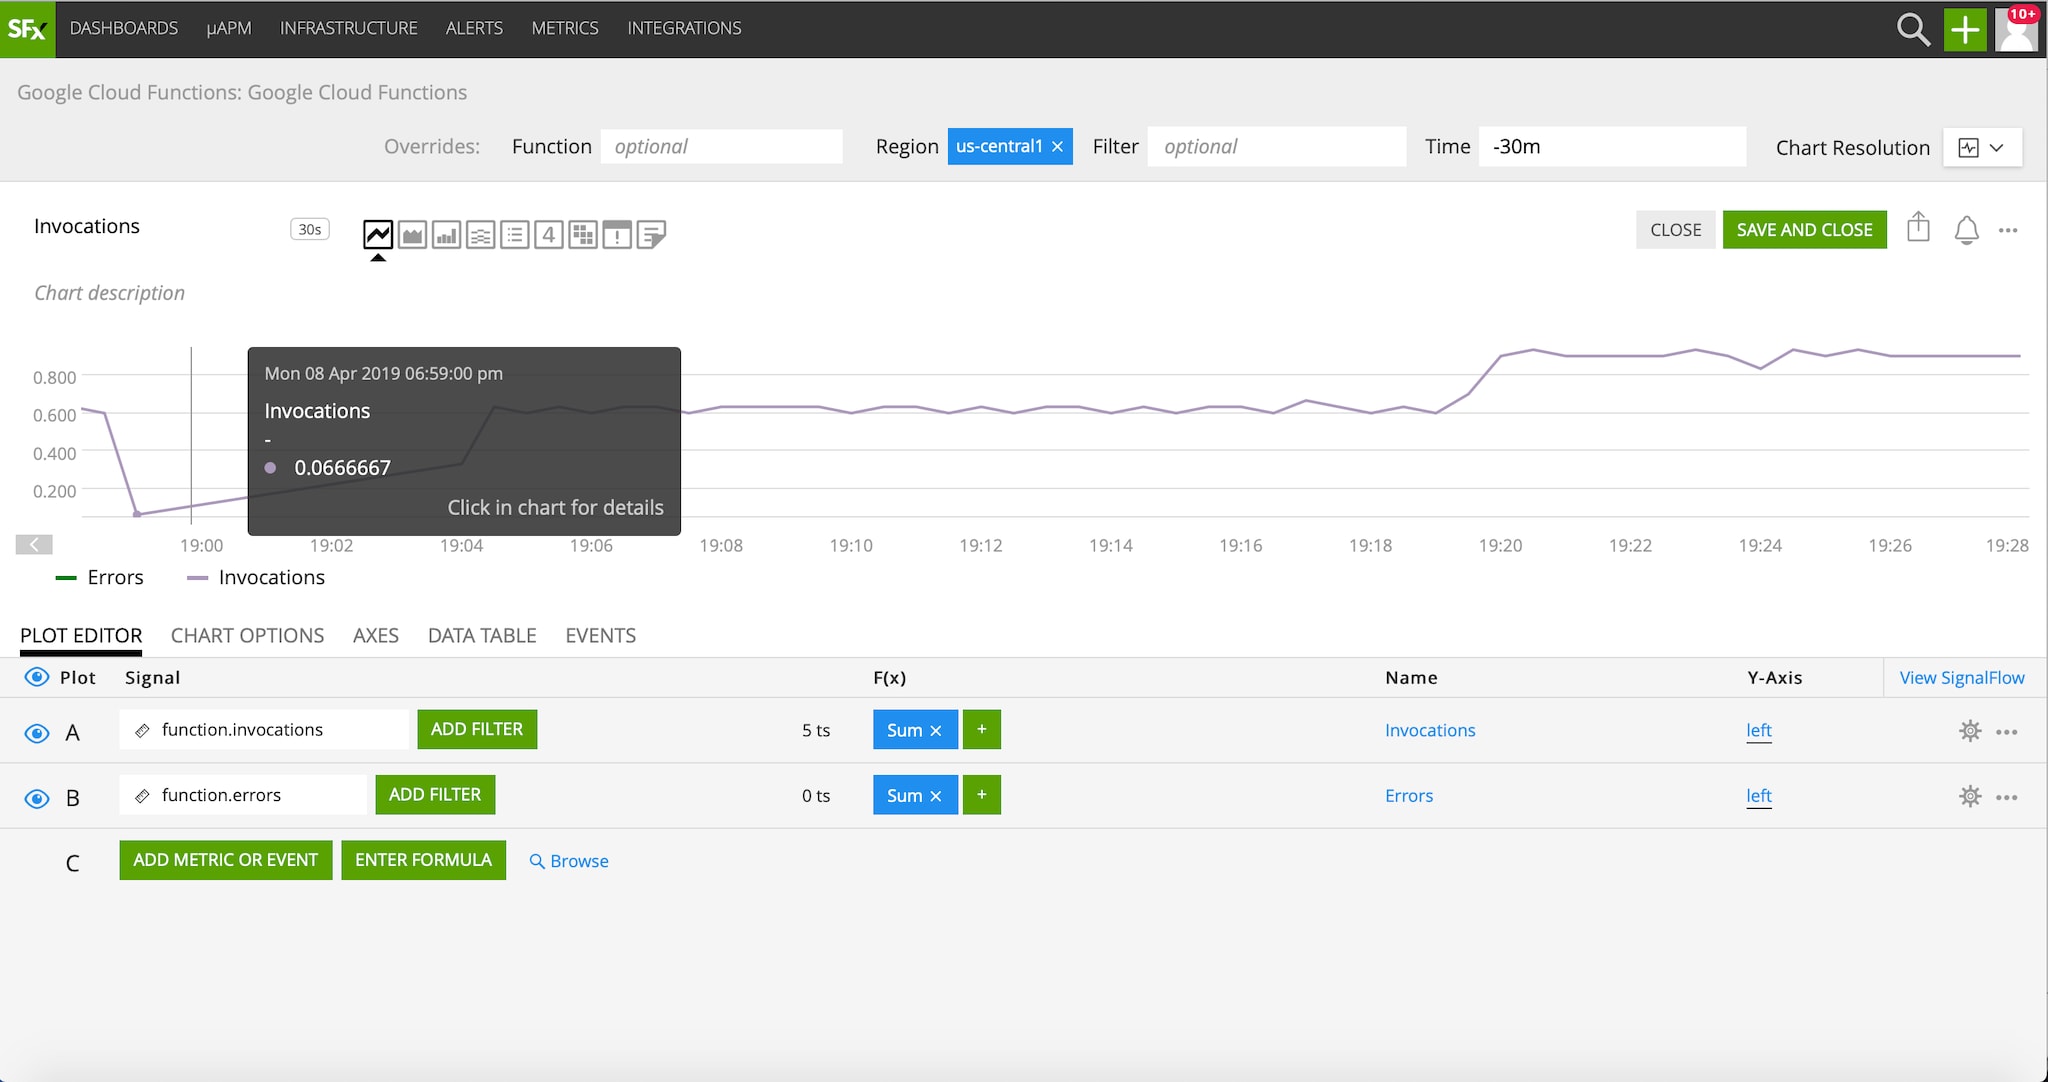
As always, getting metrics and distributed traces into Splunk is just the start for monitoring your functions. Once the data is coming into Splunk Infrastrucuture Monitoring, not only do you have immediate access to the prebuilt Google Cloud specific dashboards, but you also get dynamically generated service maps giving you a unified view of your serverless functions and overall microservices environment. You also have the ability to use the data in custom charts (simple example below) using advanced SignalFlow analytics, set up real-time alerts that will warn you about issues before they impact your business, or automate processes (e.g. auto-remediate, auto-scaling) using instant webhooks.
We’ve Made It Easy to Get Started
Google Cloud Functions offer significant benefits to development teams that just want a place to run their code without having to worry about any operational concerns. Splunk Infrastructure Monitoring is the only platform that can deliver a truly real-time monitoring solution that matches the speed, scale, and variety of data coming from your modern stack. That’s why we encourage you to try Splunk Infrastructure Monitoring for your serverless environments.
Thanks,
Ryan Powers
Related Articles
About Splunk
The Splunk platform removes the barriers between data and action, empowering observability, IT and security teams to ensure their organizations are secure, resilient and innovative.
Founded in 2003, Splunk is a global company — with over 7,500 employees, Splunkers have received over 1,020 patents to date and availability in 21 regions around the world — and offers an open, extensible data platform that supports shared data across any environment so that all teams in an organization can get end-to-end visibility, with context, for every interaction and business process. Build a strong data foundation with Splunk.


