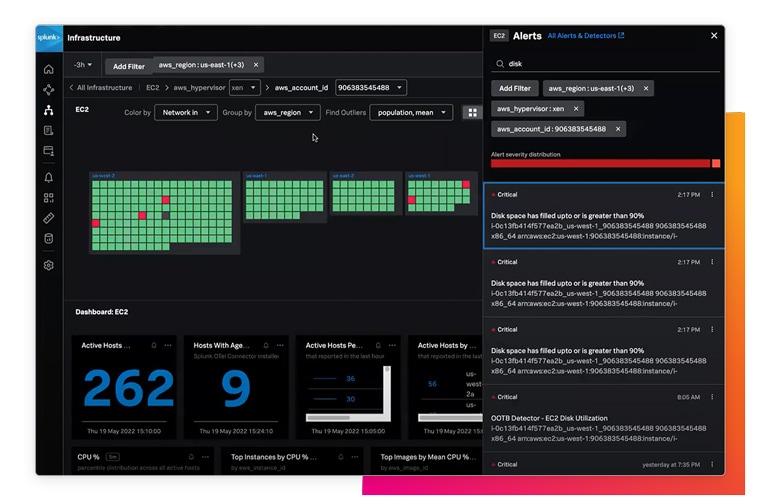
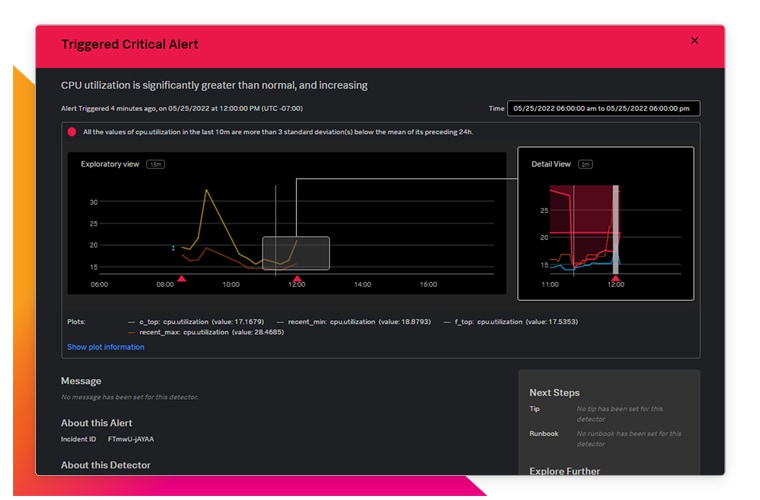
Improve hybrid cloud performance with instant visibility and real-time alerts.
OVERVIEW
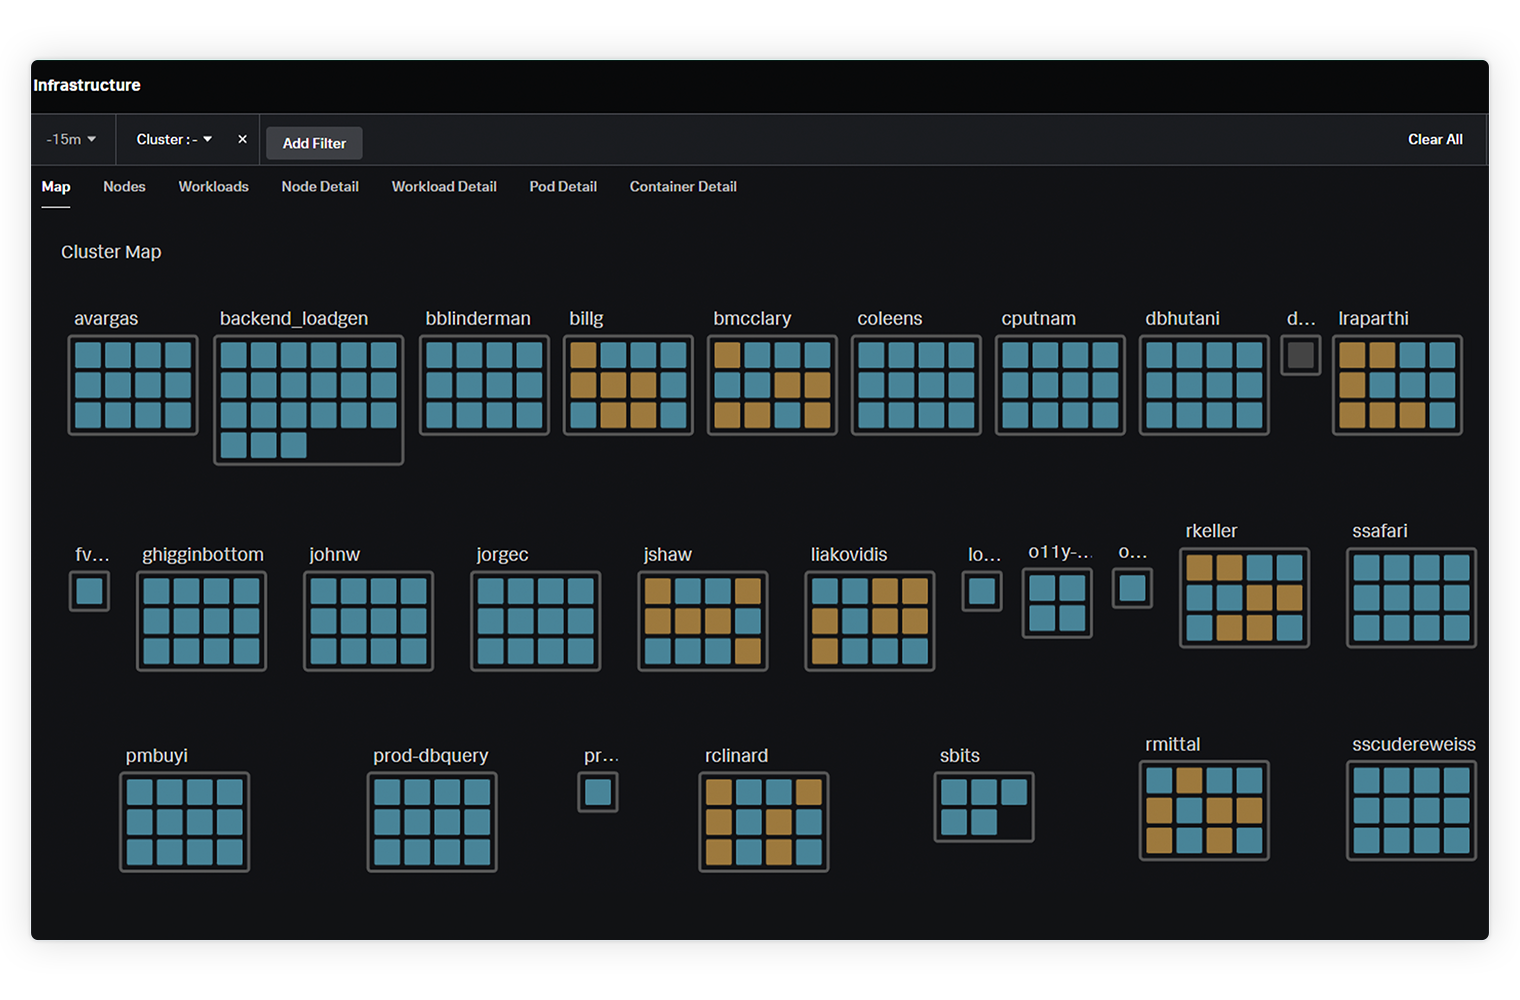
Powering containerization and portability
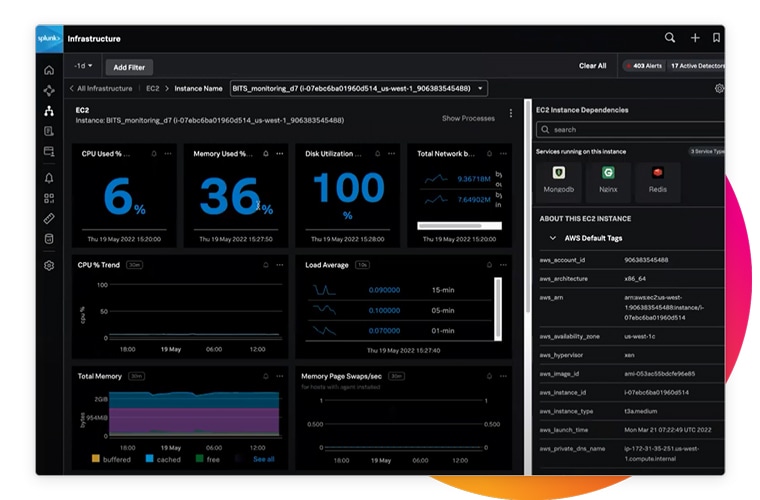
Kubernetes has become the standard for deploying containerized applications and achieving portability across multicloud environments. But this comes with a lot of operational complexity when trying to isolate problems. DevOps and site reliability engineering teams need to visualize and monitor performance of the entirety of Kubernetes deployments.