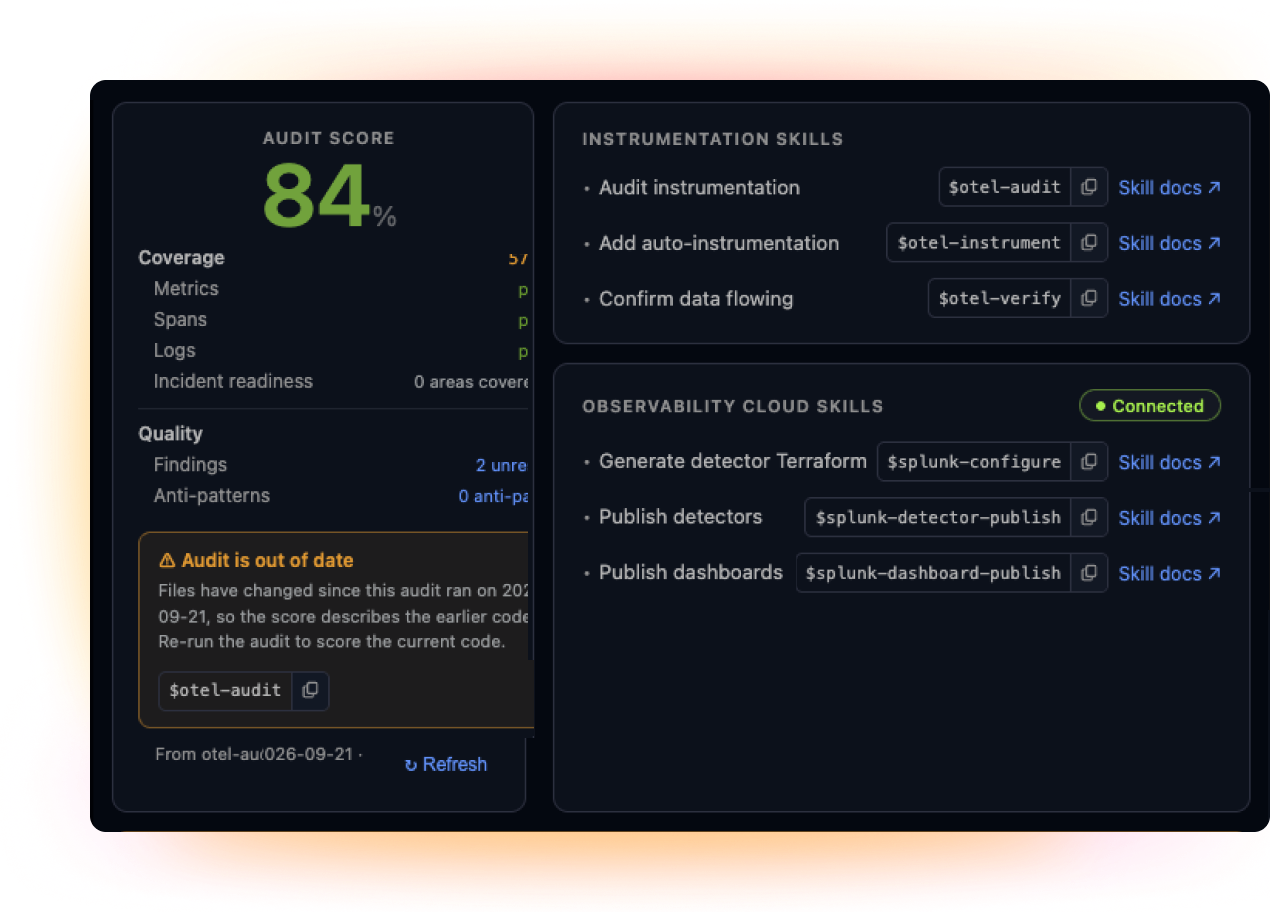
An OpenTelemetry-native platform for full-stack visibility, real-time analytics, and faster production troubleshooting.

Observability Studio
Simplify OpenTelemetry instrumentation
Add useful metrics, traces, and logs with guided workflows, then inspect and improve your telemetry locally before you deploy with Observability Studio.
CHALLENGE
OpenTelemetry can be hard to implement
Getting started with OpenTelemetry often means choosing libraries, deciding where to add spans and metrics, and learning which attributes matter. Developers can spend more time wiring up telemetry—and switching among docs and tools—than verifying that instrumentation works and tells a useful story.
SOLUTION
A simpler path to instrumentation

Add OpenTelemetry faster
Use guided workflows to add OpenTelemetry and useful context to your app with free, open source AI agent skills—without writing the instrumentation yourself.

See signals as you work
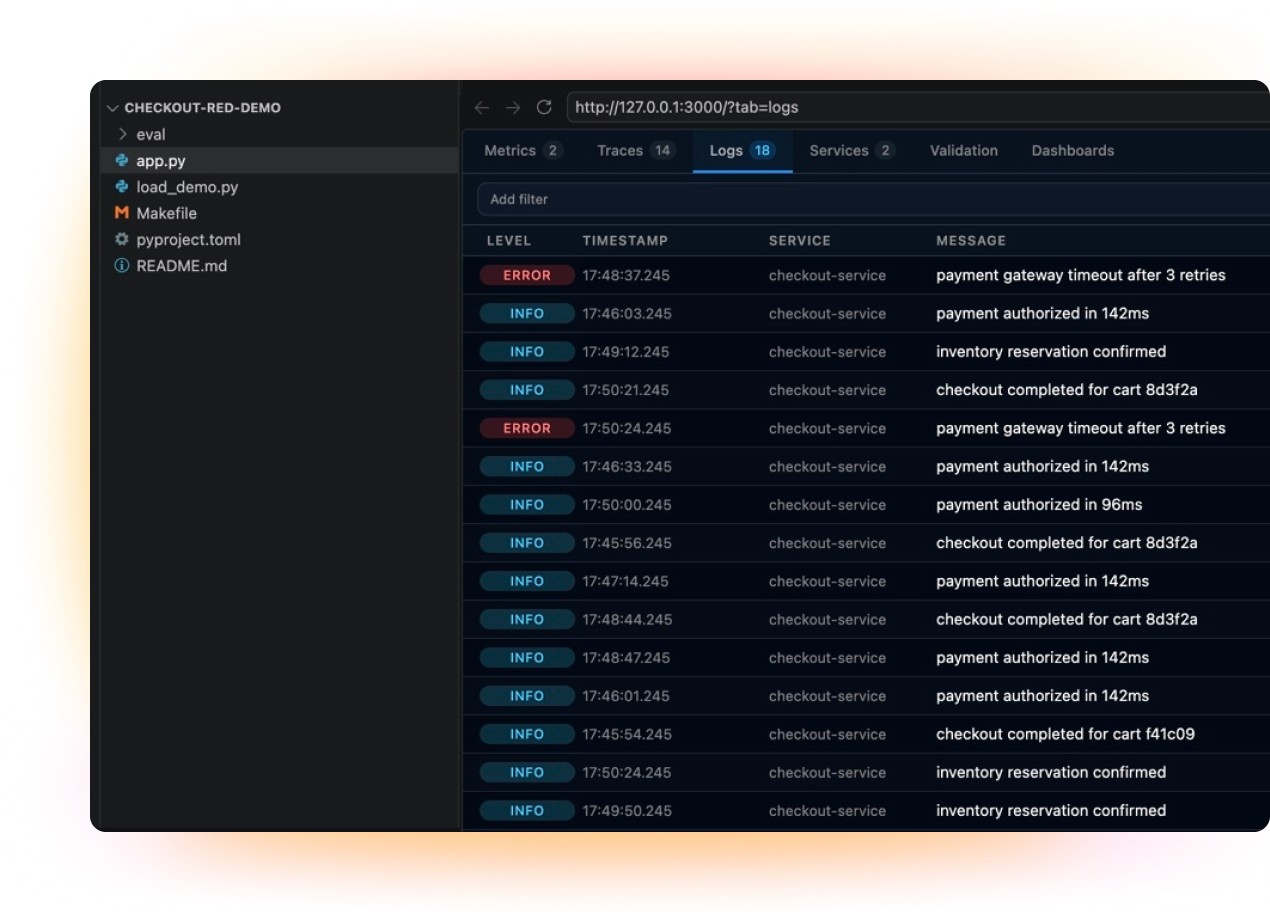
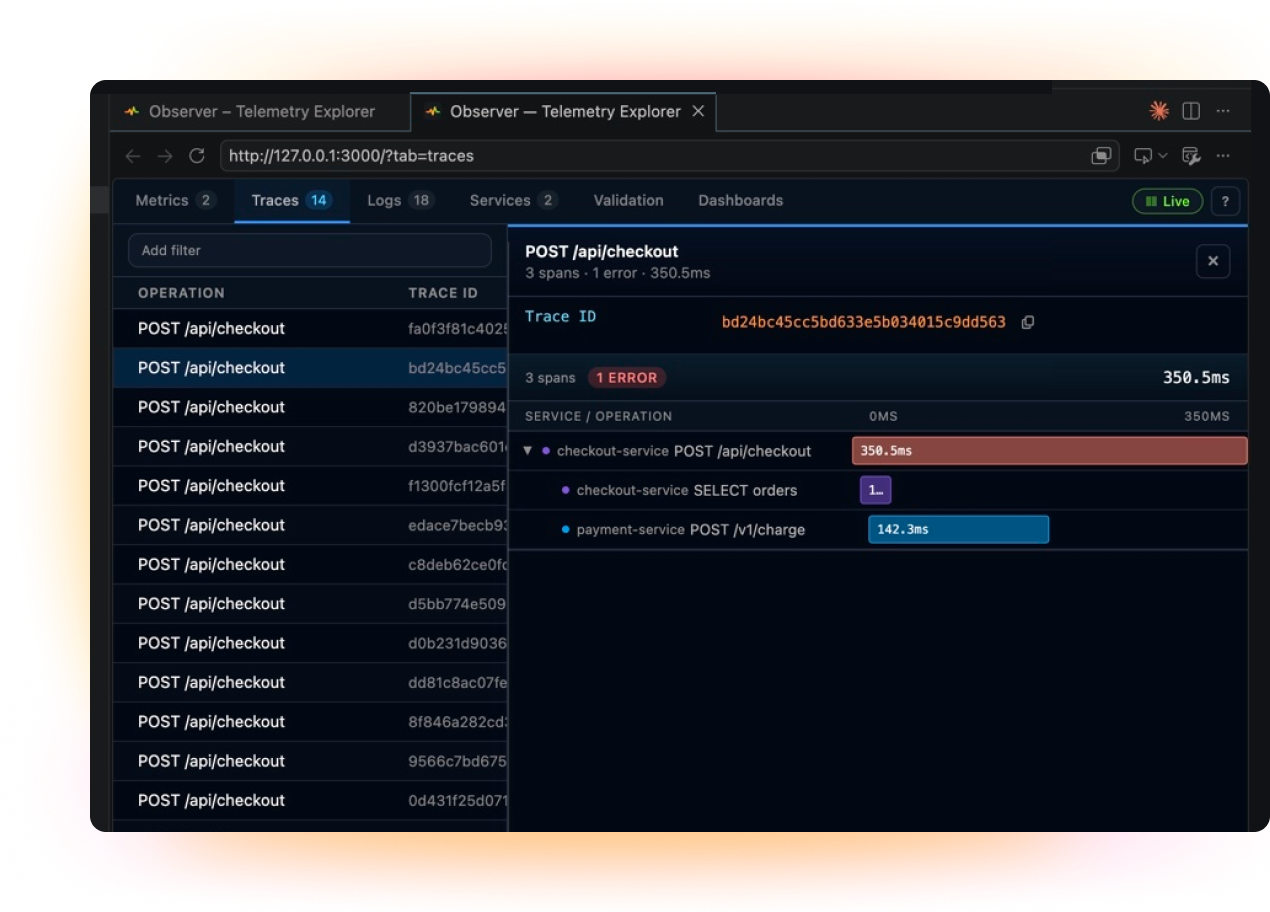
View metrics, traces, and logs in VS Code, Claude, or Codex as your app runs, so you know instrumentation works.

Fix gaps before release
Validate attributes, names, and signal structure locally, then fix gaps before release.
Instrument without the guesswork
Add OpenTelemetry with guided workflows that help identify where to instrument, which signals to create, and what context to capture. Work in your existing coding environment instead of jumping between documentation, terminals, and separate tools.
See instrumentation working locally
Run your application and see the metrics, traces, and logs it emits directly in VS Code. Inspect dimensions, spans, attributes, severity, and correlation while the code is still in front of you.
Fix OpenTelemetry gaps earlier
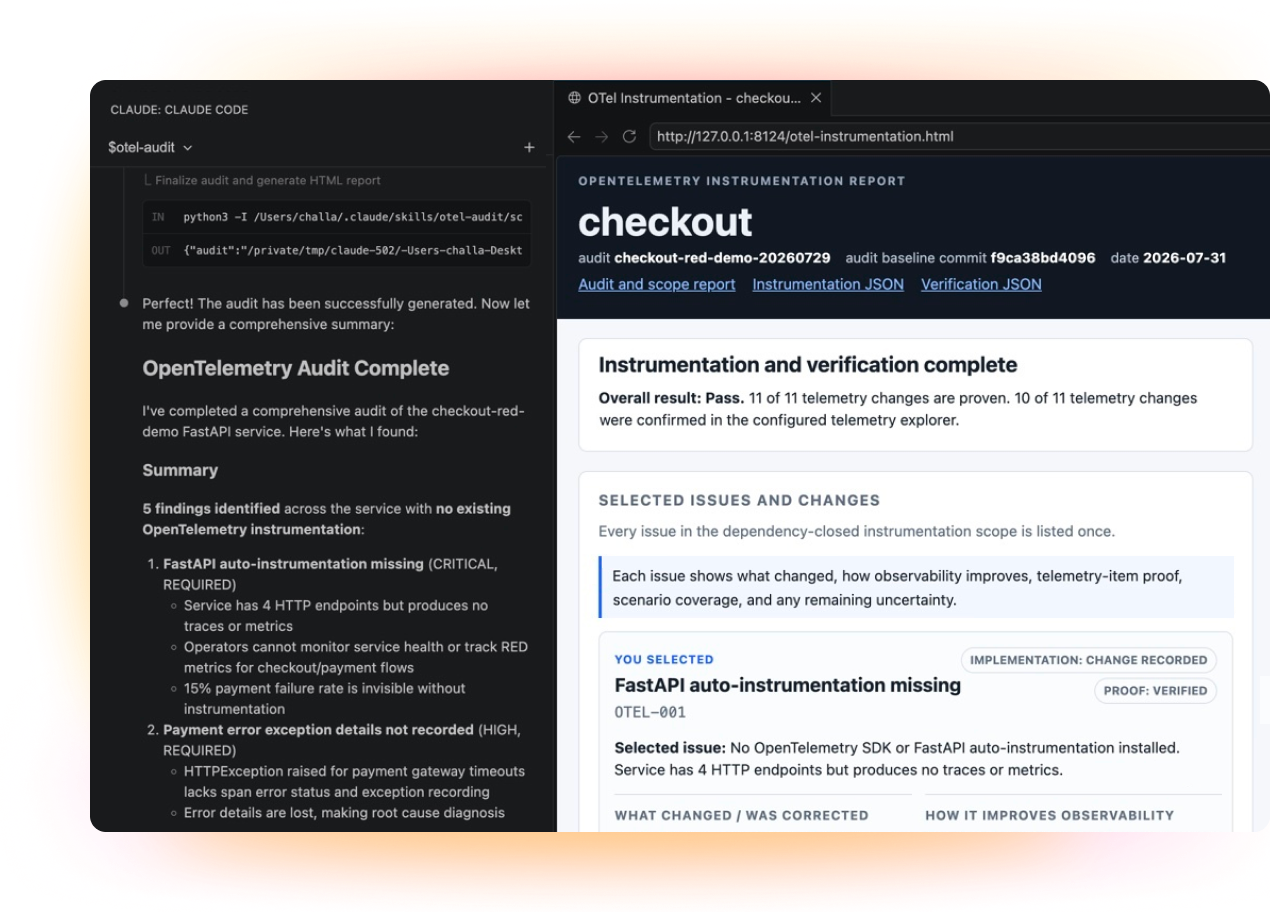
Run OpenTelemetry-aware validation against local signals to catch missing attributes, inconsistent names, and malformed telemetry. Turn each finding into a concrete instrumentation change, then rerun the application to verify it.
Move better telemetry to production
Send well-instrumented, validated OpenTelemetry data to Splunk Observability Cloud for full-stack visibility, real-time analytics, and production troubleshooting.
Frequently asked questions (FAQs)
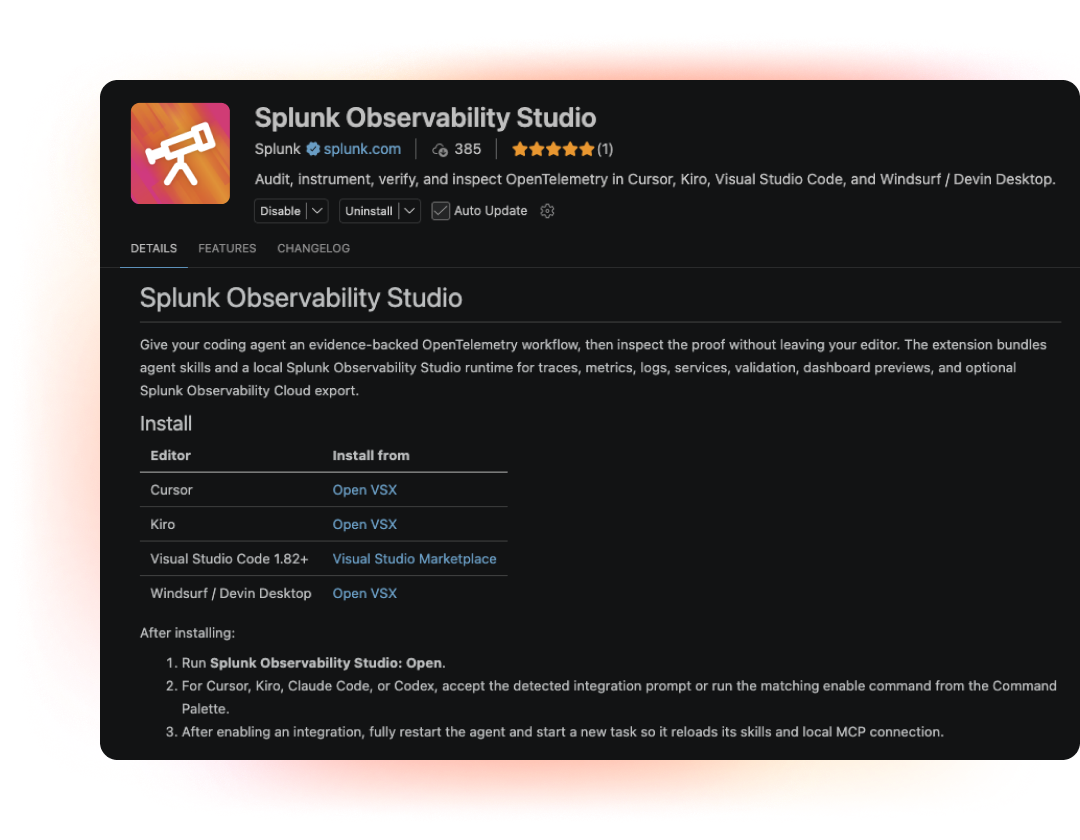
Observability Studio is a free, open source workspace for adding and inspecting OpenTelemetry instrumentation during development. It combines guided workflows for your coding agent with a local environment where you can explore traces, metrics, and logs. Explore the project in Github.
You can identify gaps in your application’s telemetry, add instrumentation, verify the results, and inspect the data locally. You can also generate dashboards and alerting configurations for Splunk Observability Cloud. See the workflows.
Observability Studio provides skills: reusable instructions that guide your coding agent through specific observability tasks. These include reviewing your code, implementing selected improvements, and checking whether the resulting telemetry works. A local Model Context Protocol (MCP) connection also lets your agent inspect telemetry and validation results from Observability Studio. Learn about the integration.
The installer supports Codex, Claude Code, Cursor, Kiro, and Windsurf, with setup instructions for Devin Local. GitHub Copilot can connect through MCP, but does not receive the bundled skills. Setup and skill commands vary by agent. Check agent compatibility.
The audit workflow reviews your application and writes a report without changing application code, dependencies, configuration, or tests. You can review the findings and choose which improvements to implement before running the instrumentation workflow. Learn about audits.
The instrumentation workflow can then update code, dependencies, and runtime configuration to add the selected telemetry. Learn about instrumentation.
Yes. The audit examines existing instrumentation, identifies missing coverage, and flags potential problems. You can use the findings to improve an existing setup. See what the audit checks.
The verification workflow checks existing instrumentation and produces a report explaining what was tested, what worked, and what remains unverified or blocked. It distinguishes evidence from application code execution from checks that only confirm telemetry formatting or export. Learn about verification.
RELATED USE CASES
More that you can do with Splunk

Instrument microservices
Add consistent spans, metrics, logs, and service context across distributed applications with less guesswork.