HOW IT WORKS

Observability
Splunk Synthetic Monitoring
Proactively find and fix performance issues across user flows, business transactions, and APIs to deliver better digital experiences.
Find and fix, faster
Detect, communicate, and resolve issues faster across webpages and APIs. End-to-end testing helps you alert and fix performance problems before customers notice.
Optimize web performance
Benchmark and improve performance across your entire user journey. From Core Web Vitals to Google Lighthouse scores, quickly identify the issues that matter most to your customers.
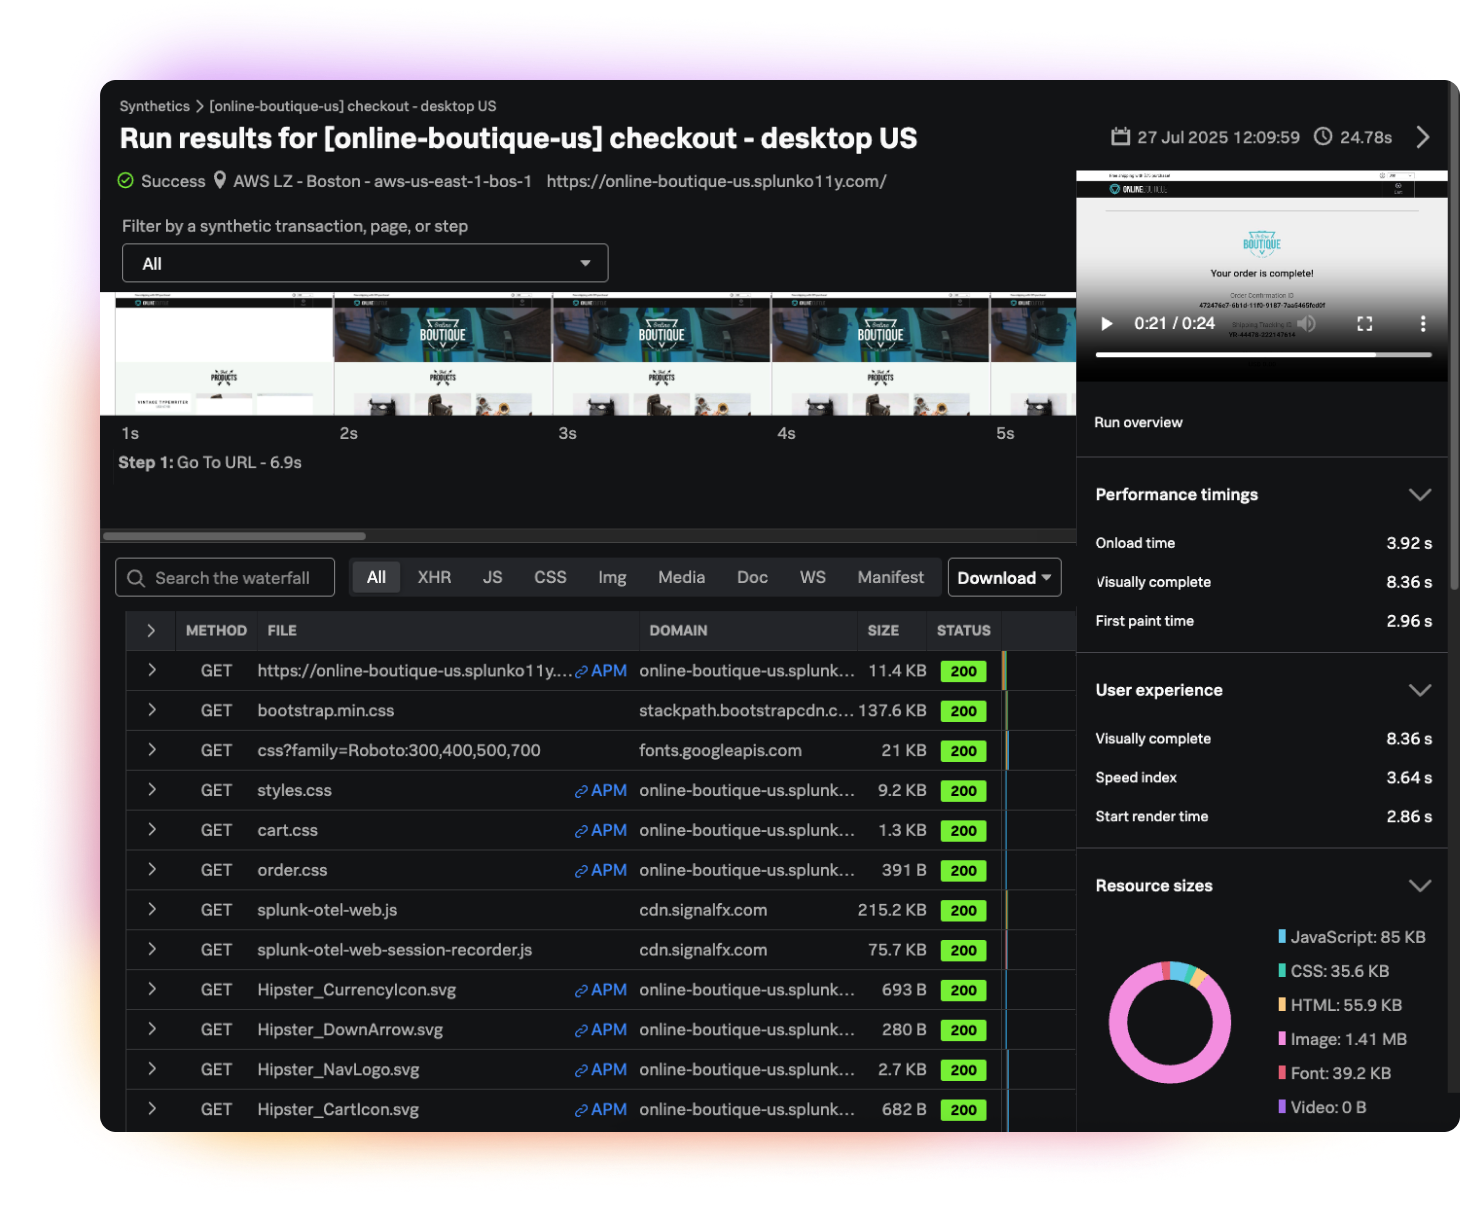
Visualize your customer experience
Measure how new code or versions impact your customer experience with film strips and video playback. Optimize how fast you deliver visual content, and improve page stability and interactivity to deploy better digital experiences.
Track and report SLOs and SLAs
Easily measure and report service-level agreement and objectives for uptime and performance. Compare your site performance against your top competitors or industry standards.
Features
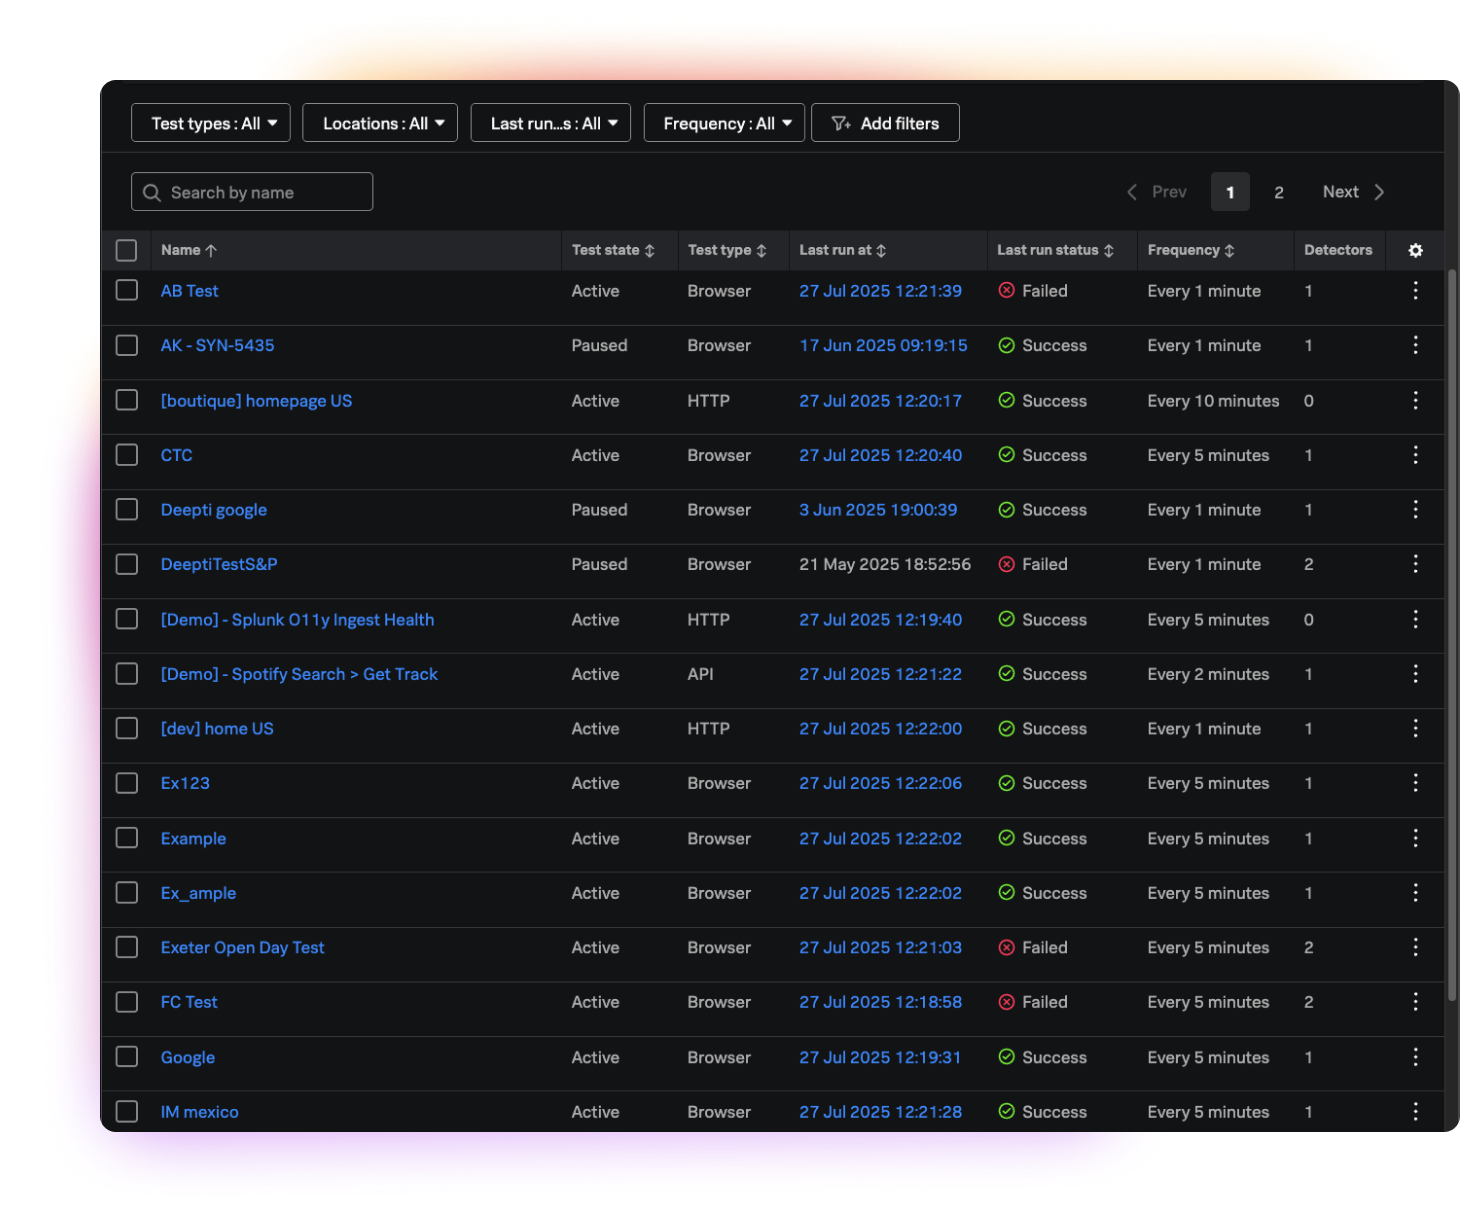
Best-in-class synthetic monitoring
Find, fix, and prevent web performance issues from impacting your customers.
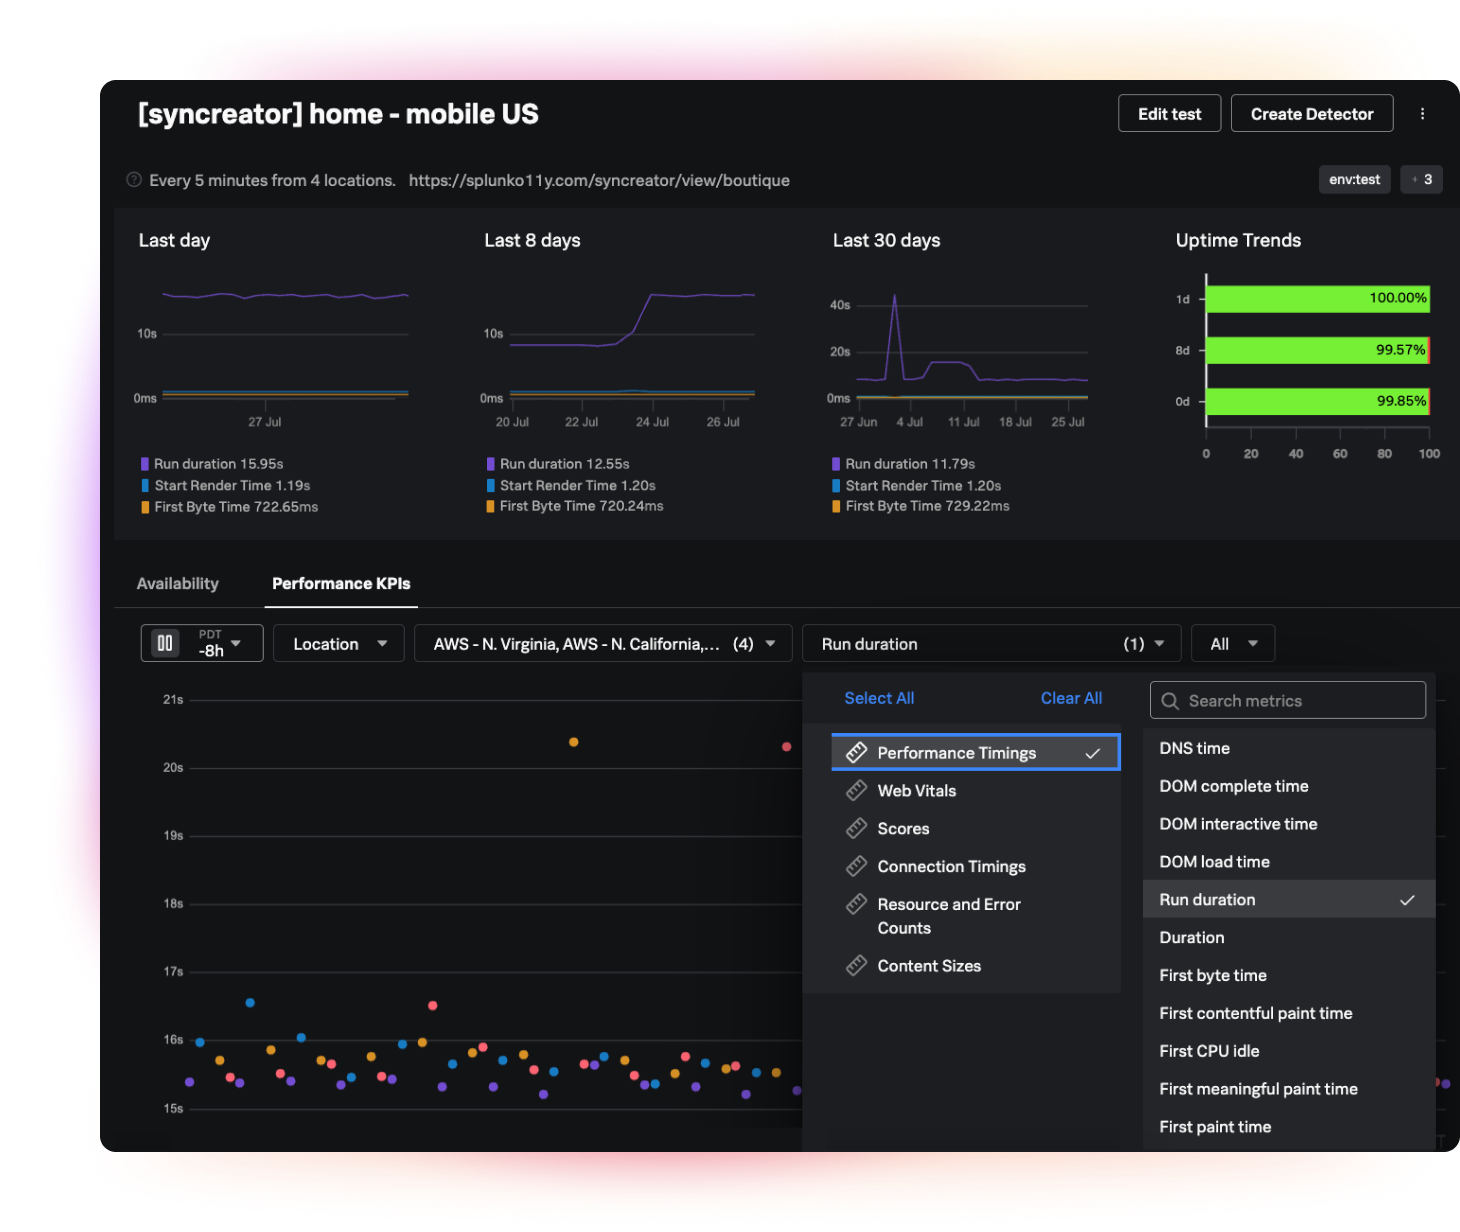
Uptime and performance tracking and reporting
Easily measure, report, and create dashboards to show SLAs for availability and performance alongside your entire alert history.
Improved user journeys
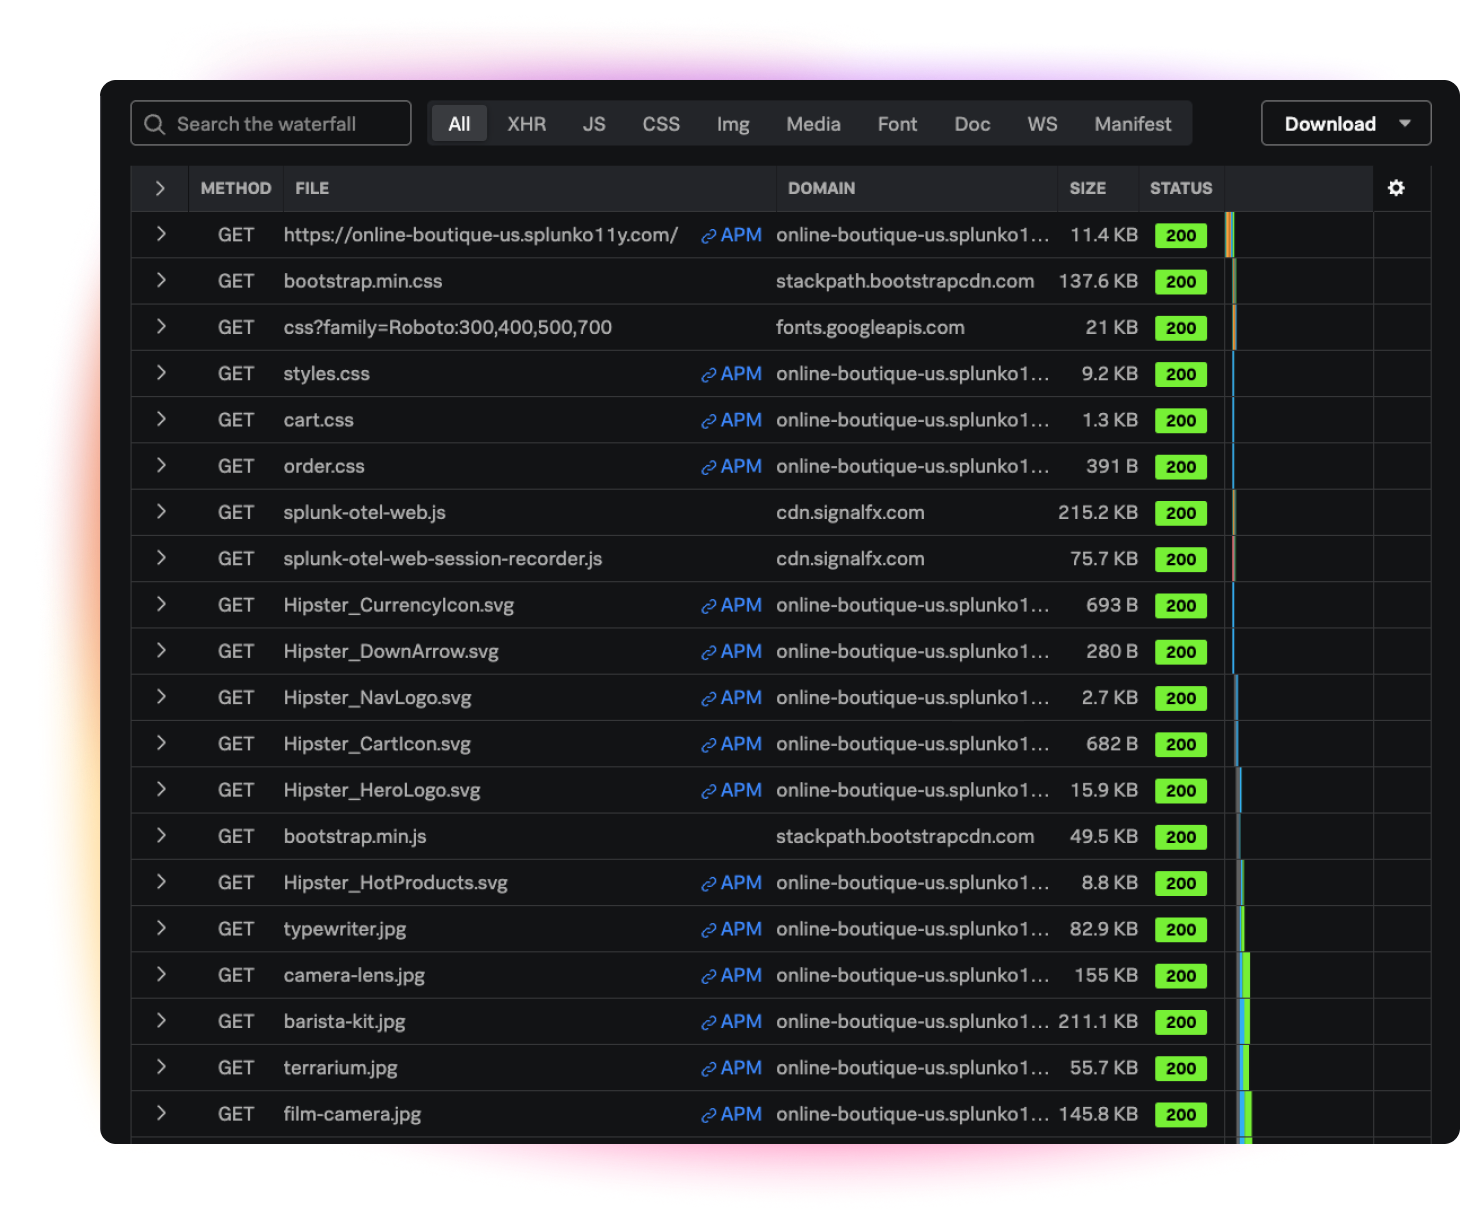
Test and improve page speed and functionality for all page resources, APIs, and third-party dependencies in your entire user flow.
Automated performance within dev pipelines
Automatically pass/fail builds based on performance budgets within your continuous integration/continous delivery pipelines.
Filmstrips, screenshots, recorded screen playback
See exactly how end users experience your site on web and mobile.
End-to-end visibility
Follow the story of your data from front-end to backend, and see how every synthetic test is impacted by backend services.
Competitive benchmarking
Compare your site performance to the competition and industry standards to prioritize improvements.

Are you a current Observability Cloud customer looking for learning resources?
Check out our Observability Learning Path on Splunk Community, with curated content organized by skill level.
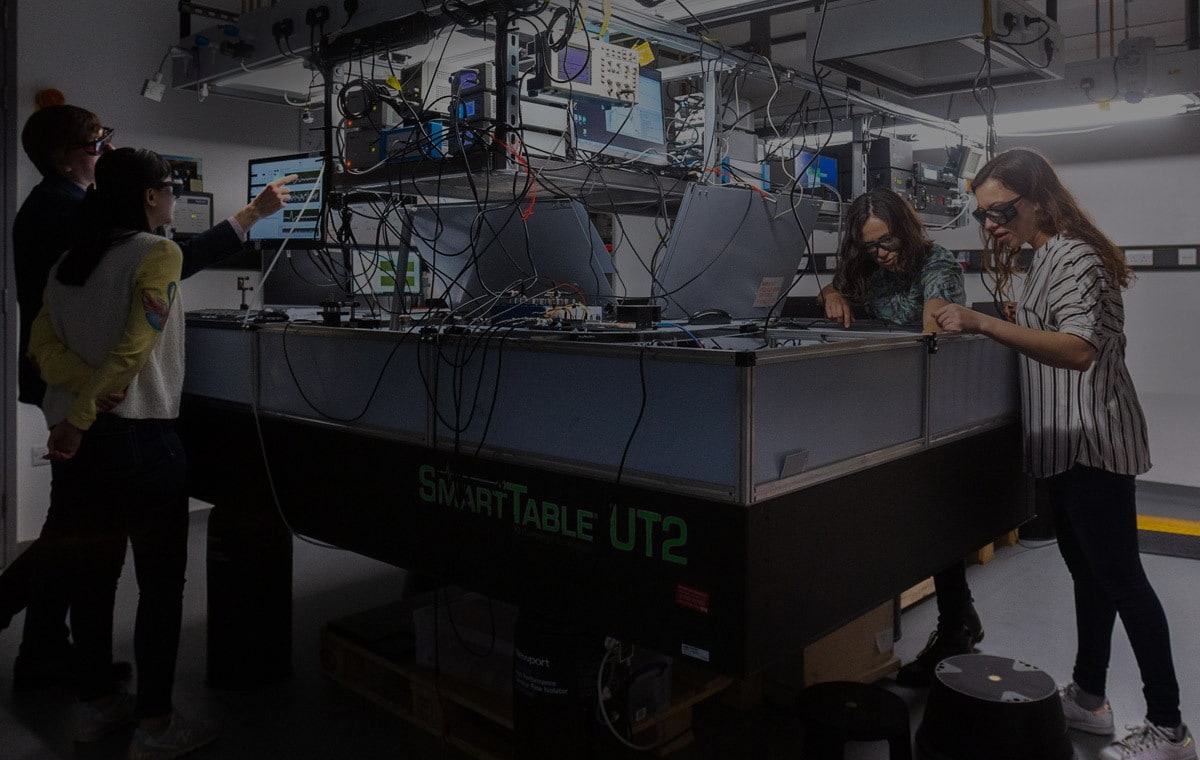
CUSTOMER STORY

Imperial College London Protects Its “Mini City” With Splunk
Splunk Cloud Platform can ingest data from the services we use, and Splunk Synthetic Monitoring can monitor our users and services — no matter where they’re located around the world
17,000
students and 8,000 staff protected
100+
services successfully monitored, with data coming in from more than 60 different sources


Application Performance Monitoring
Solve problems faster in monoliths and microservices by immediately detecting problems from new changes, confidently troubleshooting the source of an issue and optimizing service performance.
Logs in Observability
Log analysis across your cloud-native application and cloud environments.
Real User Monitoring
The only full-fidelity, end-to-end visibility solution for end-user experience.
Infrastructure Monitoring
The only real-time, analytics-driven multicloud monitoring solution for all environments.
Splunk AppDynamics
Observe and secure your hybrid and on-prem applications across every environment.
Business and IT Service Monitoring
Protect service-level agreements and monitor service health with intelligent event management and ITSM integrations.