
Digital Resilience Pays Off
Download this e-book to learn about the role of Digital Resilience across enterprises.
Did you know that my data makes me healthier?
Yeah, it helps me to fight the Battle of the Bulge!
No, I don’t mean the actual Battle of the Bulge, but rather the one around my waist.
Yeah, that one. The fatty blubbery one that I used to carry around all day long everywhere I went. That “horizontal tire”, as I would sometimes call it on occasion. Yeah, that’s the one.
Well, not anymore! Not ever since I exported my year-long history of daily caloric intake, weight measurements, and amount of water consumption from my LiveStrong.com account and splunked it all.
That’s right! For the last year, I have manually logged each meal I’ve eaten, how many glasses of water I’ve drank, and what I’ve weighed on a daily basis. And, of course, the Livestring.com folks have worked hard to provide a simple reporting tool for viewing all of these measurements over time in a graphical report of sorts.
However, I found that I could not correlate ALL of these measurements on a single graph so that my brain could notice any patterns or interesting points regarding what I eat and drink and what I weigh just might be related somehow.
That’s when it occurred to me that, even though my data was human-generated (and NOT machine-generated like we always talk about), I could still splunk it and correlate it like I really wanted. After all, Splunk is capable of this sort of thing and pretty easily too.
So first, I had to figure out how to get the data exported from my LiveStrong.com account, which turned out to be fairly easy to do since there was an option to export your log history to a CSV format, which I did.
The resulting CSV file included all of the info I wanted to splunk, but it was in three entire “sections”, almost like it was three separate log files concatenated into one CSV file.
Therefore, I had to manually cut out the three separate log listings and paste them each into their own log file on disk.
Here is a sample of what the events from each of these files look like:
#— LiveStrong.com – Sample Meal Event
Date:,"March 10, 2012",,,,,,,,,,,,,,,,,,

Meals,,,,,,,,,,,,,,,,,,,
Meal,Item Brand,Item Name,Your Servings,Your Total Calories,Your Total Sugars,Your Total Carbs,Your Total Fats,Your Total Protein,Your Total Cholesterol,Your Total Sodium,Your Total Dietary Fiber,Calories,Sugars,Carbs,Fats,Protein,Cholesterol,Sodium,Dietary Fiber
breakfast,,Corn Tortillas,1,100,0,22,1,3,0,20,2,100,,22g,1g,3g,0mg,20mg,2g
breakfast,All Whites,Egg Whites,2,60,0,2,0,12,0,190,0,30,0g,1g,0g,6g,0mg,95mg,0g
breakfast,Hormel,Microwave Ready Bacon Original,1,80,0,0,7,5,15,300,0,80,0g,0g,7g,5g,15mg,300mg,0g
afternoon snack,,4% Cottage Cheese Great Value,1,110,3,4,5,12,25,440,0,110,3g,4g,5g,12g,25mg,440mg,
afternoon snack,Cuties California Clementines,Clementine,0.5,40,6.5,8.5,0.25,0.5,0,0,2,80,13g,17g,0.5g,1g,0mg,0mg,4g
dinner,,Baked Potatoes,0.5,55,0.5,13,0,1,0,0,1,110,1g,26g,0g,2g,0,0mg,2g
dinner,,Broccoli,1,31,2,6,0,3,0,30,2,31,2g,6g,0g,3g,0mg,30mg,2g
dinner,Outback Steakhouse,Outback Special 6oz Sirloin,1,332,0,0.7,19.3,37,109.5,562.3,0.2,332,,0.7g,19.3g,37.0g,109.5mg,562.3mg,0.2g
dinner,Daisy,Sour Cream,0.5,30,0.5,0.5,2.5,0.5,10,7.5,0,60,1g,1g,5g,1g,20mg,15mg,0g
Fitness,,,,,,,,,,,,,,,,,,,
No exercises were recorded.,,,,,,,,,,,,,,,,,,,
Totals:,,,,,,,,,,,,,,,,,,,
,,,,Calories,Sugars,Carbohydrates,Fat,Protein,Cholesterol,Sodium,Dietary Fiber,,,,,,,,
,,,,838,12.5,56.7,35.05,74,159.5,"1,549.80",7.2,,,,,,,,
,,,,Calories Allowed,"1,100.00",,,,,,,,,,,,,,
,,,,Calories Consumed,838,,,,,,,,,,,,,,
,,,,Calories Burned,0,,,,,,,,,,,,,,
,,,,Net Calories,838,,,,,,,,,,,,,,
#— LiveStrong.com – Sample Water Events
Date,,Glasses
2011-01-01,,5
2011-01-02,,5
2011-01-03,,7
2011-01-04,,8
2011-01-05,,5
2011-01-06,,6
2011-01-07,,6
2011-01-08,,4
2011-01-10,,6
2011-01-11,,7
     .
     .
     .
#— LiveStrong.com – Sample Weight Event
Date :,"October 9, 2011"
Weight=182.00
Next, I had to configure my Splunk indexer to properly handle these custom log events and extract some of the more interesting fields, which was pretty easy to do, as it always is with Splunk.
Here are inputs.conf and my props.conf files for your review and consideration:
#— inputs.conf
[monitor://$SPLUNK_HOME/etc/apps/search/logs/livestrong/ls_myplate_meal.csv]
sourcetype=csv
host=ls_meal

[monitor://$SPLUNK_HOME/etc/apps/search/logs/livestrong/ls_myplate_weight.csv]
sourcetype=csv
host=ls_weight

[monitor://$SPLUNK_HOME/etc/apps/search/logs/livestrong/ls_myplate_water.csv]
sourcetype=csv
host=ls_water
#— props.conf
[water]
TIME_PREFIX = ^
TIME_FORMAT = Y%-%m-%d,

[meal]
SHOULD_LINEMERGE = true
BREAK_ONLY_BEFORE = Date\:\,
TIME_PREFIX = ^Date\:\,
TIME_FORMAT = "%b %d, %Y"
EXTRACT-calories = Calories Consumed\,\"(?<Consumed_Calories>\S+?)\"\,
EXTRACT-meal = (?m)(?<Meal>^[^Date|Meals].*?)\,(?<Item_Brand>.*?)\,(?<Item_Name>.*?)\,(?<Servings>\d+?)\,(?<TCalories>\d+?)\,(?<TSugars>.*?)\,(?<TCarbs>.*?)\,(?<TFats>.*?)\,(?<TProtein>.*?)\,(?<TCholesterol>.*?)\,(?<TSodium>.*?)\,(?<TDietary_Fiber>.*?)\,(?<Calories>\d+?)\,(?<Sugars>.*?)\,(?<Carbs>.*?)\,(?<Fats>.*?)\,(?<Protein>.*?)\,(?<Cholesterol>.*?)\,(?<Sodium>.*?)\,(?<Dietary_Fiber>.*?)


[weight]
SHOULD_LINEMERGE = true
BREAK_ONLY_BEFORE = Date
TIME_PREFIX = ^Date \:\,\"
TIME_FORMAT = %b %d, %Y
Now that we have indexed the LiveStrong log files containing all of my event information and we have our field extractions setup correctly, we can now go into the Search App within Splunk GUI and start building a nice correlated search.
First, we need to make sure we search all three types of log events: one from the Meal file, one from the Weight file, and one from the Water file. We do this by listing them based on the host they are coming from, which I hardcoded to match the type of file each one is. We use Boolean ORs to make sure we get events from ALL file hosts, like this:
host="ls_weight" OR (host="ls_water" NOT Date) OR host="ls_meal"
NOTE that for the Water events, I also need to NOT search for the events that contain the header lines with the term “DATE” in the event.
Once I get event results appearing in the Search App, I can now pipe to a timechart command to graph out the more interesting values by time, like this:
host="ls_weight"  OR (host="ls_water" NOT Date) OR host="ls_meal"
| timechart span=1w sum(Weight) as Weight, sum(Glasses) as Glasses, sum(Consumed_Calories) as Calories
However, when I run this search, I end up with only Calories value showing in the graph. The other values for Weight and Glasses are scaled way below the Calories line and practically flattened out and not very useful.
But have no fear, I can pipe to an eval command and scale the other values as needed to make them proportional to one another. Specifically, I will need to scale up the Glasses value while scaling down the Calories value, thus bringing them both into the same value range as the Weight value, like this:
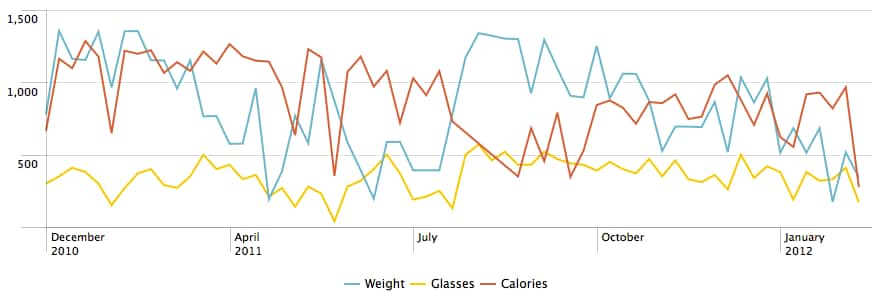
host="ls_weight"  OR (host="ls_water" NOT Date) OR host="ls_meal"
| timechart span=1w sum(Weight) as Weight, sum(Glasses) as Glasses, sum(Consumed_Calories) as Calories
| eval Calories = Calories / 10 | eval Glasses = Glasses * 10
…and this is the resulting graph
As I look at this graph, I notice a criss-crossing of data in the middle there and so I select the time range for the area to zoom in and get a better view of the correlation of my weight, my caloric intake, and how many glasses of water I’m drinking.
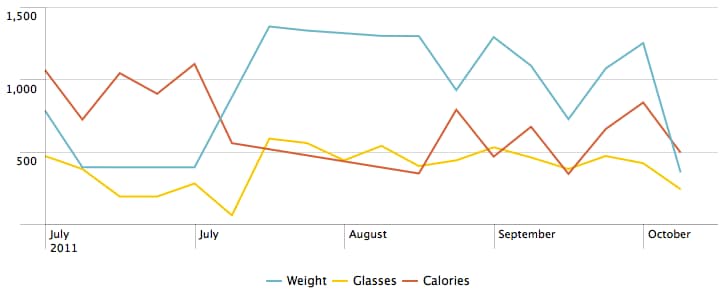
One thing that becomes obvious in the zoomed-in view of the data is the fact that as my water intake decreased and my caloric intake was still high, I seemed to gain weight.
Another interesting behavior to note here is that after I gained the weight, I decreased my caloric intake and increased my water intake and the weight slowly and steadily came back off again. Perhaps the fact that I’m basically starving myself is the reason why I’m losing the weight again.
But can I prove this somehow by graphing out the breakdown of my caloric intake and correlate that with my weight measurements?
I don’t know. So let’s try it!
First, let’s search on the Meal event and the Weight events first, similar to what we did in the first search, like this:
host="ls_meal" OR host="ls_weight"
Good. Now let’s pipe to a timechart command and graph out the totals of caloric types by time.
However, instead of listing the values of consumed calories, lets sum up the total of each type of calories to see what we get:
host="ls_meal" OR host="ls_weight"
| timechart span=1mon sum(Weight) as Weight, sum(TSodium) as Sodium, sum(TCarbs) as Carbs, sum(TFats) as Fats, sum(TProtein) as Protein, sum(TCholesterol) as Cholesterol
Again, we will need to use the eval command to scale the Weight measurement to match that of the total caloric values. This time, we will need to use a rather large multiplier, or factor, to scale it up enough, as shown in this final search:
host="ls_meal" OR host="ls_weight"
| timechart span=1mon sum(Weight) as Weight, sum(TSodium) as Sodium, sum(TCarbs) as Carbs, sum(TFats) as Fats, sum(TProtein) as Protein, sum(TCholesterol) as Cholesterol
| eval Weight = Weight*20000
…and this is the resulting graph
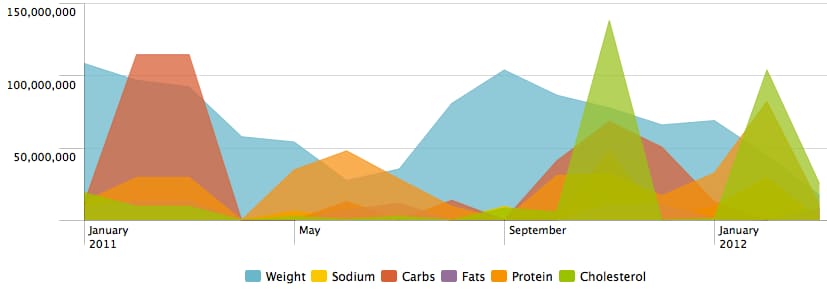
Now this one is more interesting than the first one because it indicates that I tend to lose weight when I load up more on carbs and even on cholesterol too, but if I increase proteins while cutting back on carb intake (similar to an Atkins diet), I start gaining weight again.
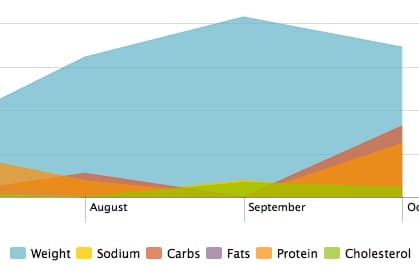
Also, if I zoom-in a bit more, I can easily see that even when I starve myself, I tend to gain weight up until I start simultaneously increasing my carb and protein intake again at the same time. Wow! Who knew?
But this does not really prove anything accept that my body chemistry is extremely complex and that there is no cure-all diet or caloric intake combination that will ensure steady weight loss.
It does, however, give my much more insight and visibility into better understanding my actual caloric chemistry as it relates to my personal weight gain/loss over time and in some ways, that is much better than guessing, which is what I was doing before I decided to splunk the LiveStrong data, right?
I hope this exercise helped to show the awesome power of Splunk and that it’s not just limited to machine-generated data and troubleshooting your servers, applications, and devices, etc.
But that you can ALSO splunk your own personal human-generated data, troubleshoot your eating habits, and learn something about yourself as well!
So the big question now is, where will your data take you?
Let’s find out at .conf2012.
Register today: http://www.splunk.com/goto/conf
----------------------------------------------------
Thanks!
Eric Gardner

The Splunk platform removes the barriers between data and action, empowering observability, IT and security teams to ensure their organizations are secure, resilient and innovative.
Founded in 2003, Splunk is a global company — with over 7,500 employees, Splunkers have received over 1,020 patents to date and availability in 21 regions around the world — and offers an open, extensible data platform that supports shared data across any environment so that all teams in an organization can get end-to-end visibility, with context, for every interaction and business process. Build a strong data foundation with Splunk.

Get the latest articles from Splunk straight to your inbox.
© 2005 - 2024 Splunk Inc. All rights reserved.
