
Digital Resilience Pays Off
How resilient is your organization? Learn how to mature your digital resilience with this free guide.

We recently released the Splunk Machine Learning Toolkit (MLTK) version 5.2 and earlier this month we outlined how the release of version 5.2 will make machine learning more accessible to more users. Splunk’s MLTK lets our customers apply machine learning to data they are already capturing in Splunk (in the cloud or on-premises), develop models, and operationalize algorithms to glean new insights and make more informed decisions. This version of the MLTK was purpose-built to help citizen developers and data scientists hone in on common use cases such as forecasting, anomaly detection, and clustering. However, we recognize there are many users with a deeper background in ML, so we have also incorporated some new, advanced capabilities in this release to suit their needs as well.
MLTK 5.2 provides more precise algorithms than “off the shelf” algorithms, which are unable to consume and process large volumes of data. Additionally, unlike open source algorithms, the MLTK bespoke algorithms are able to provide better results with partial datasets. This enables our customers to achieve more effective answers as they go about creating references, predicting data clusters, and detecting outliers.
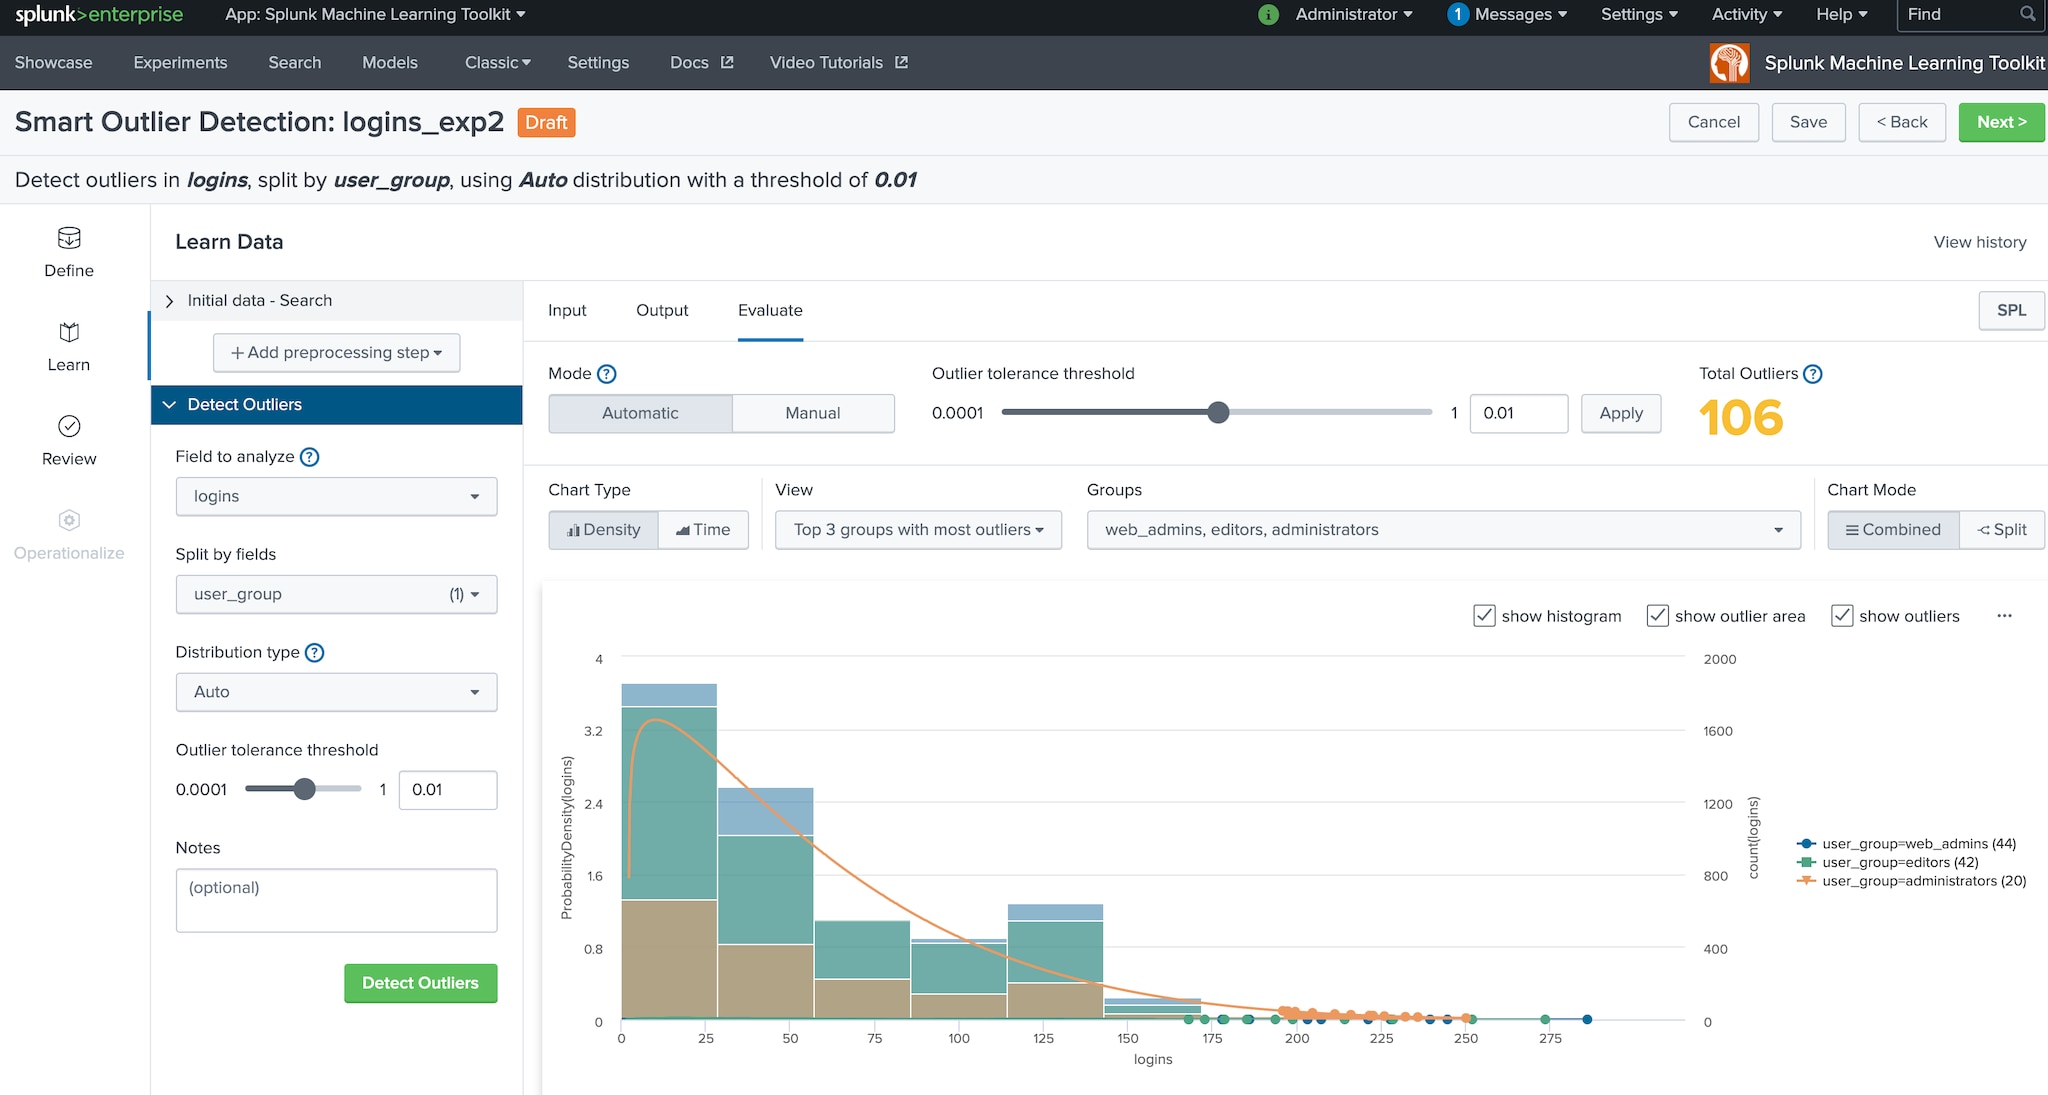
Based on feedback from our customers and their use cases, MLTK 5.2 includes both new and enhanced algorithms to utilize for quick analysis of outliers. While there are many different ways to approach anomaly detection, the easiest starter algorithm for most customers using MLTK is DensityFunction.
MLTK 5.2 introduces two improvements to the DensityFunction algorithm:
These enhancements will help our users find and take action on the root cause of an issue more quickly.
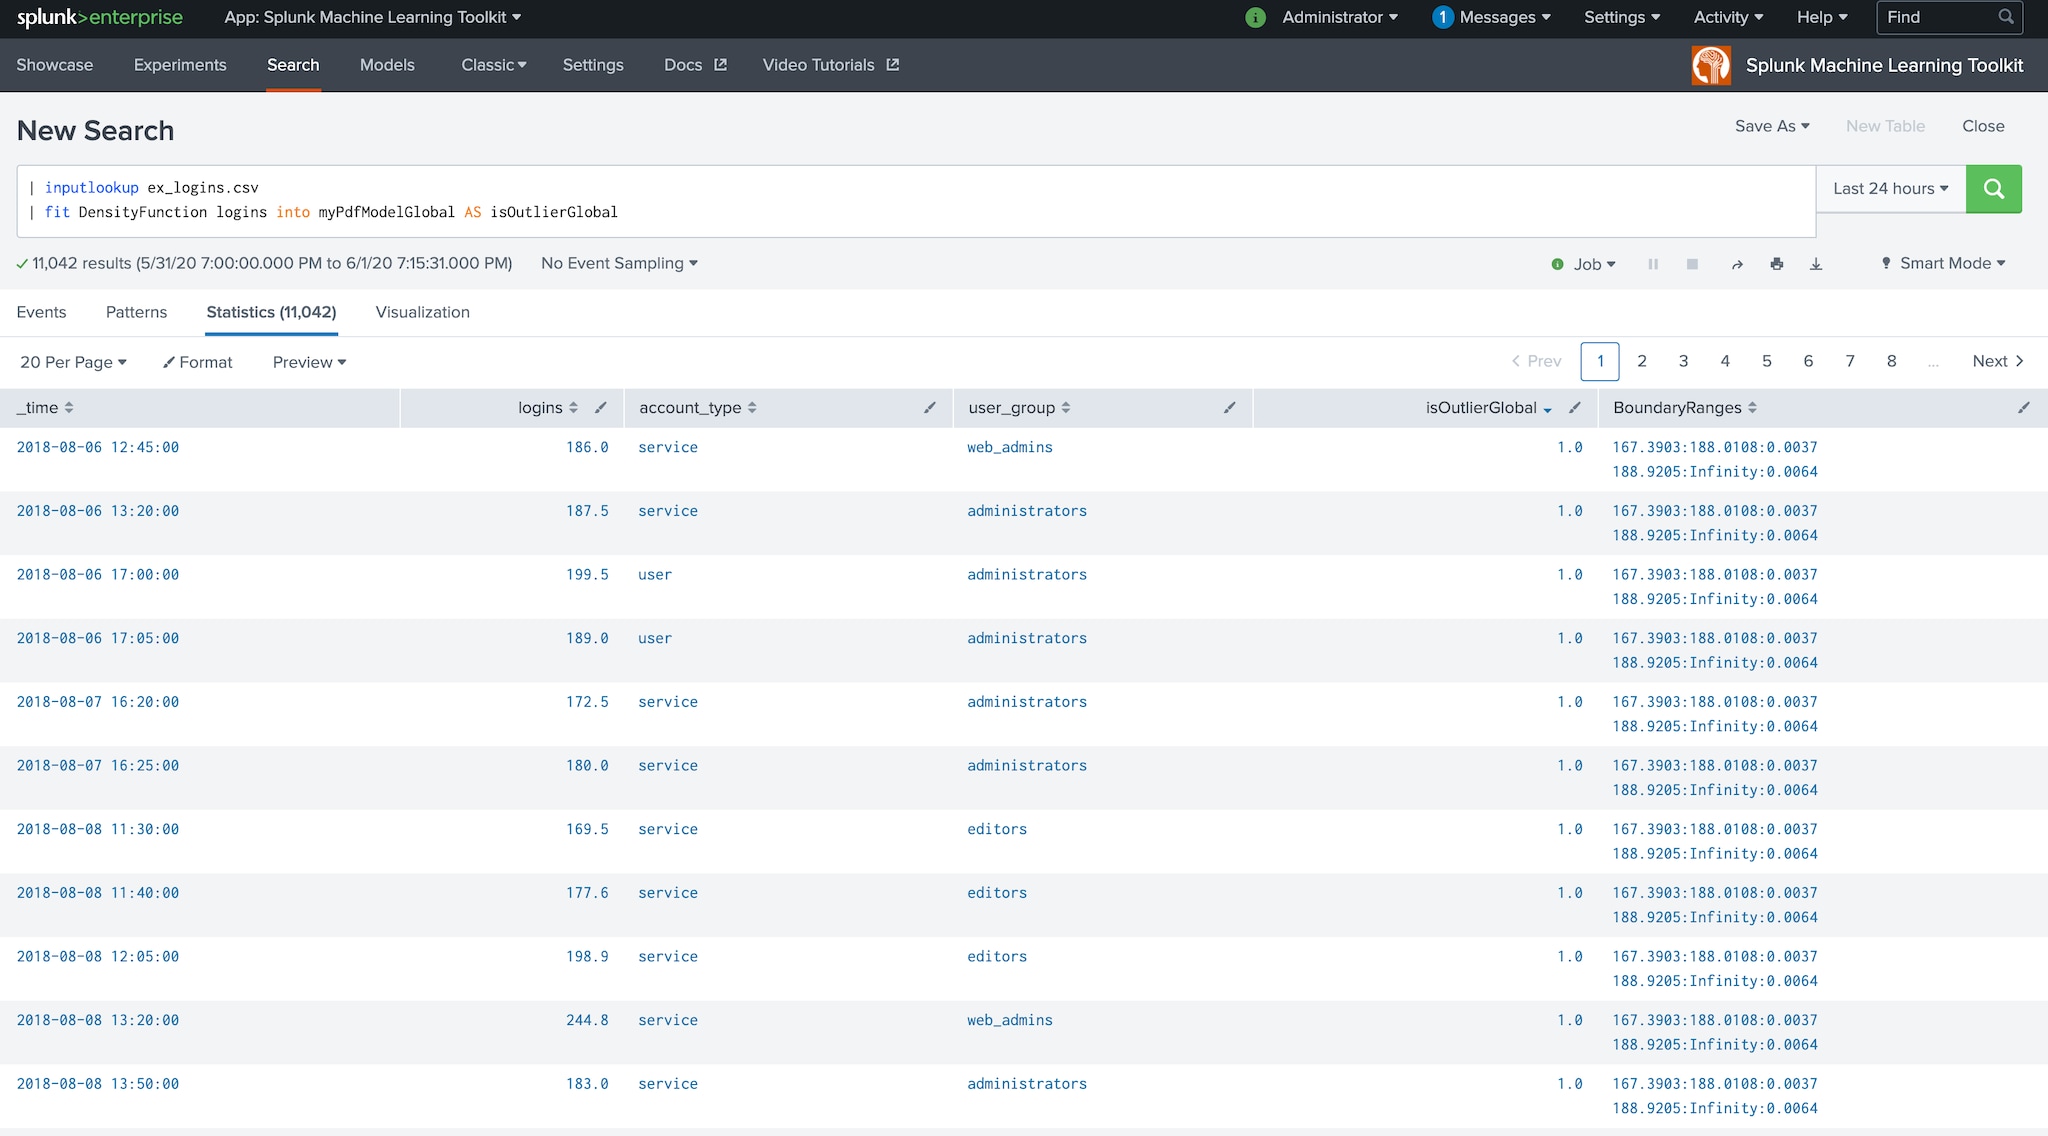
We commonly hear from customers that they struggle to improve the performance of models when they have a large number of groups that need to be split. The DensityFunction algorithm is a great tool for developing outlier detection models and can help customers think critically about their data. While one could simply run DensityFunction such as:
| fit DensityFunction logins INTO myPdfModelGlobal
AS IsOutlierGlobal
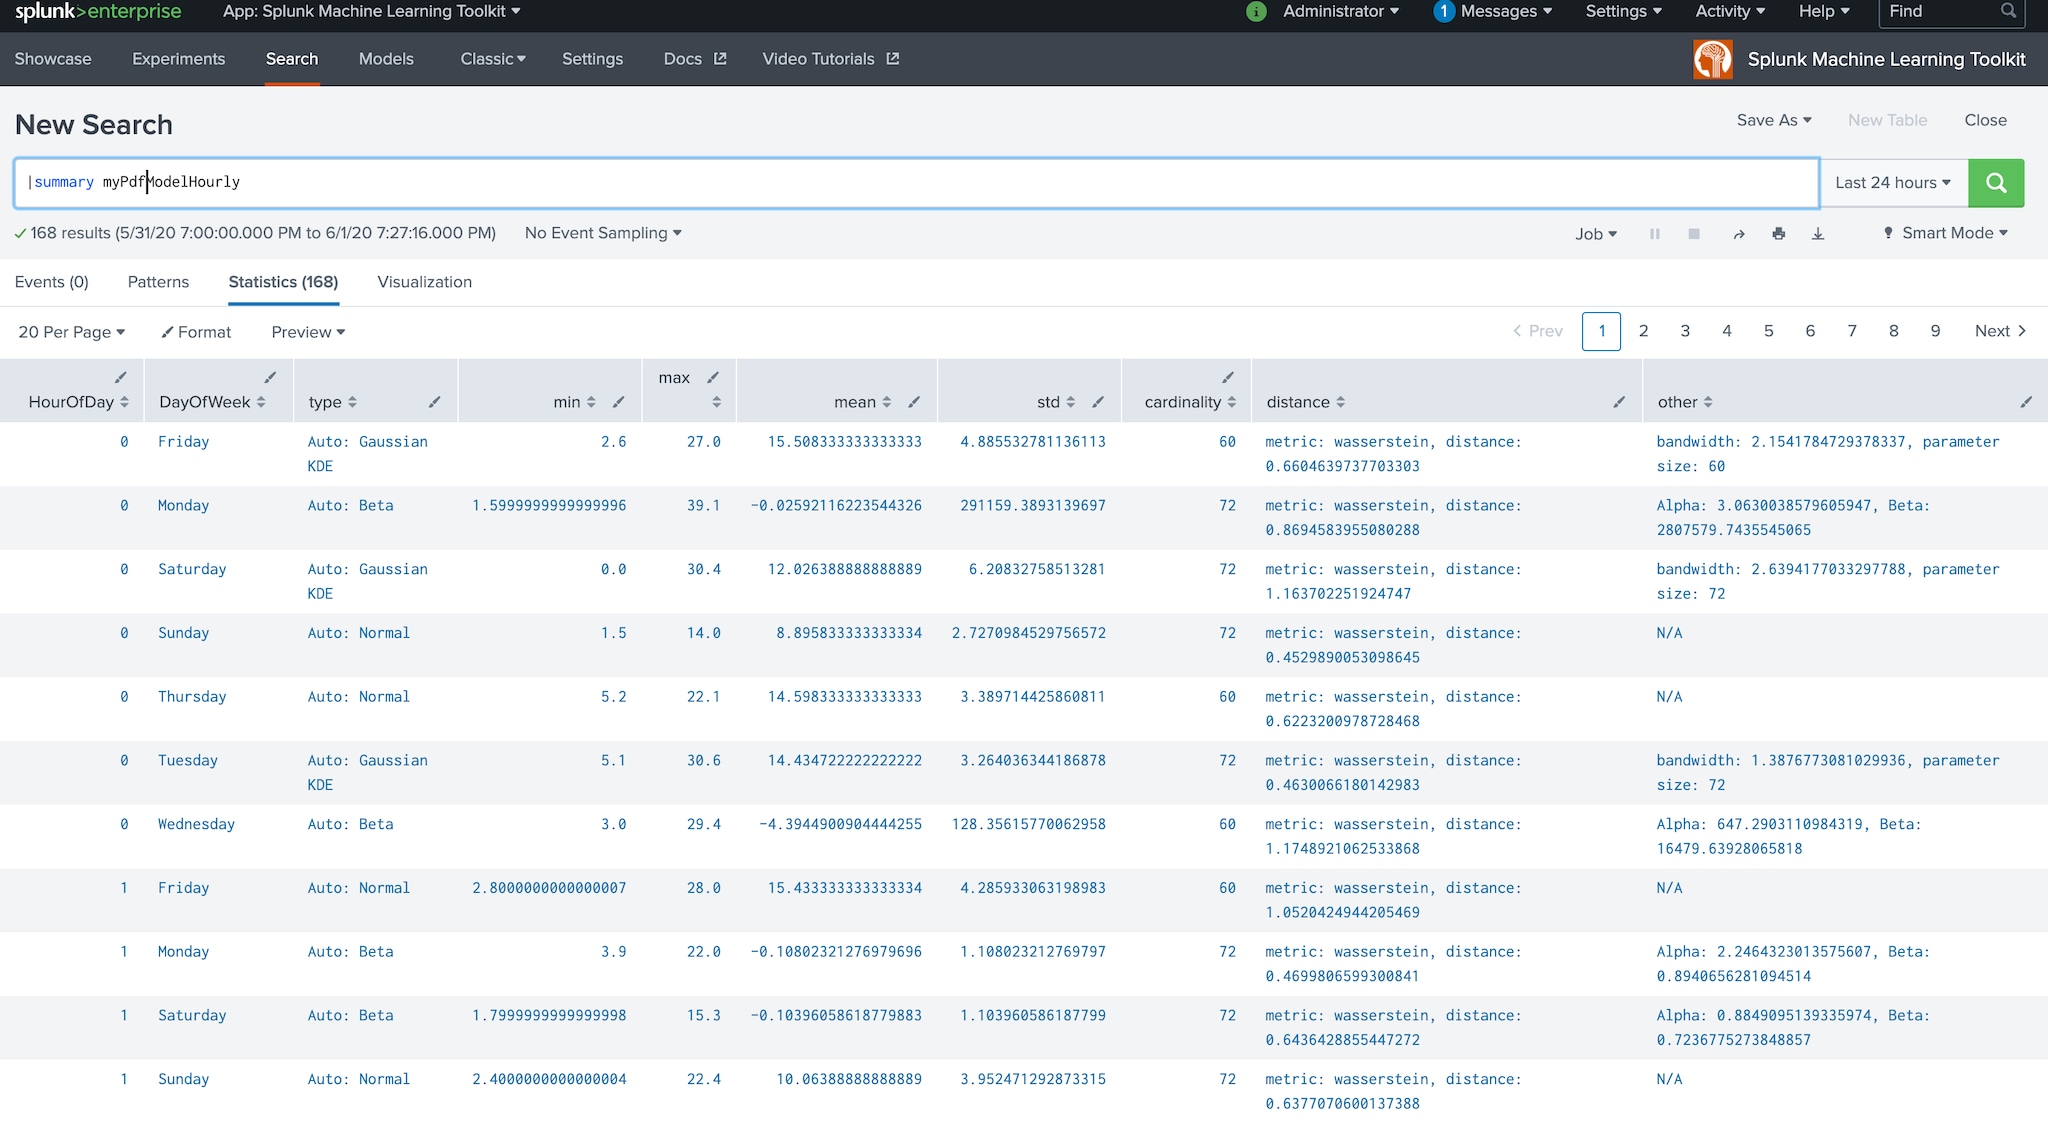
… | fit DensityFunction logins by “HourOfDay,DayOfWeek”
INTO myPdfModelHourly AS IsOutlierHourly
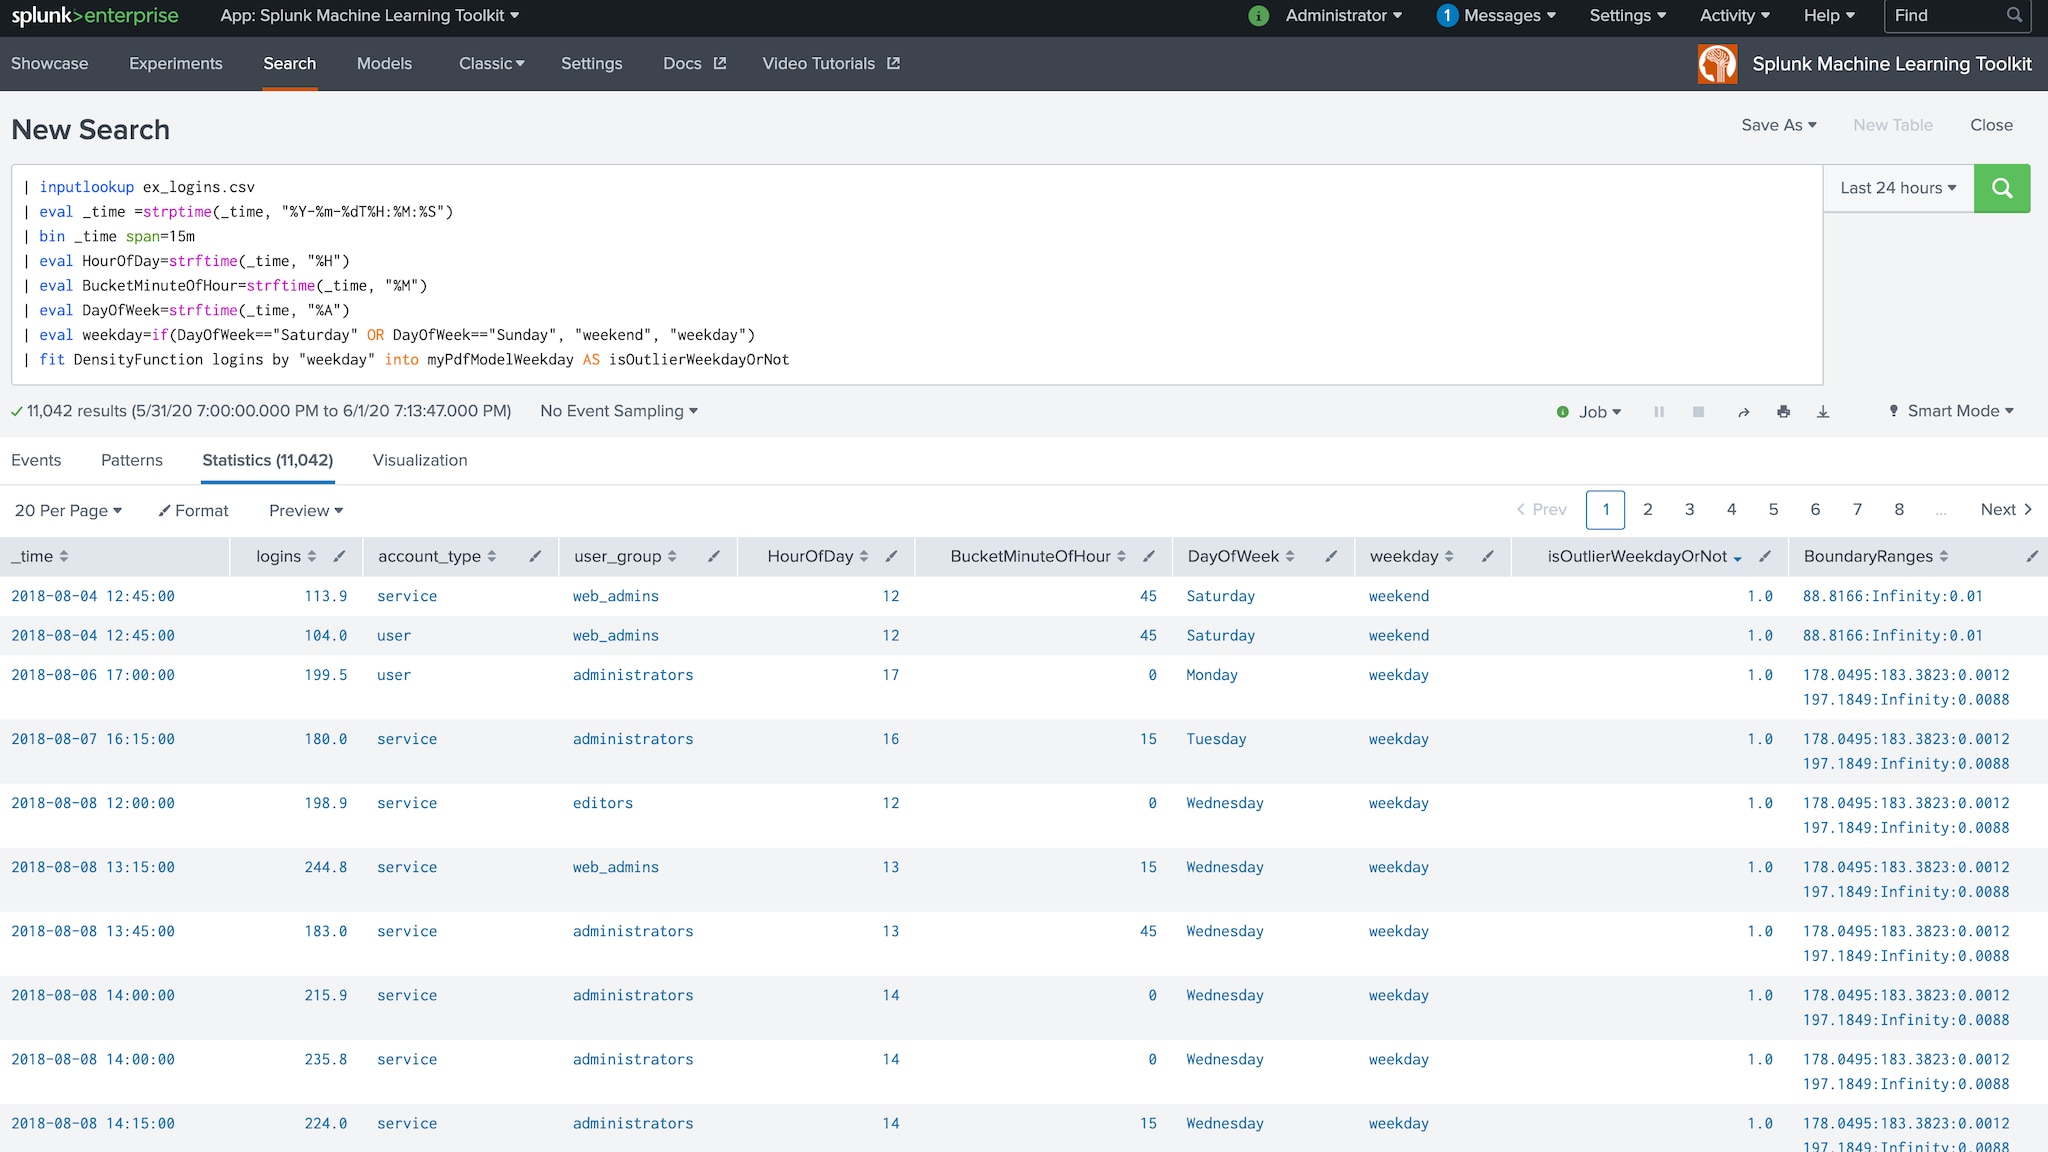
| fit DensityFunction logins by “weekday” INTO myPdfModelWeekday
AS IsOutlierWeekday
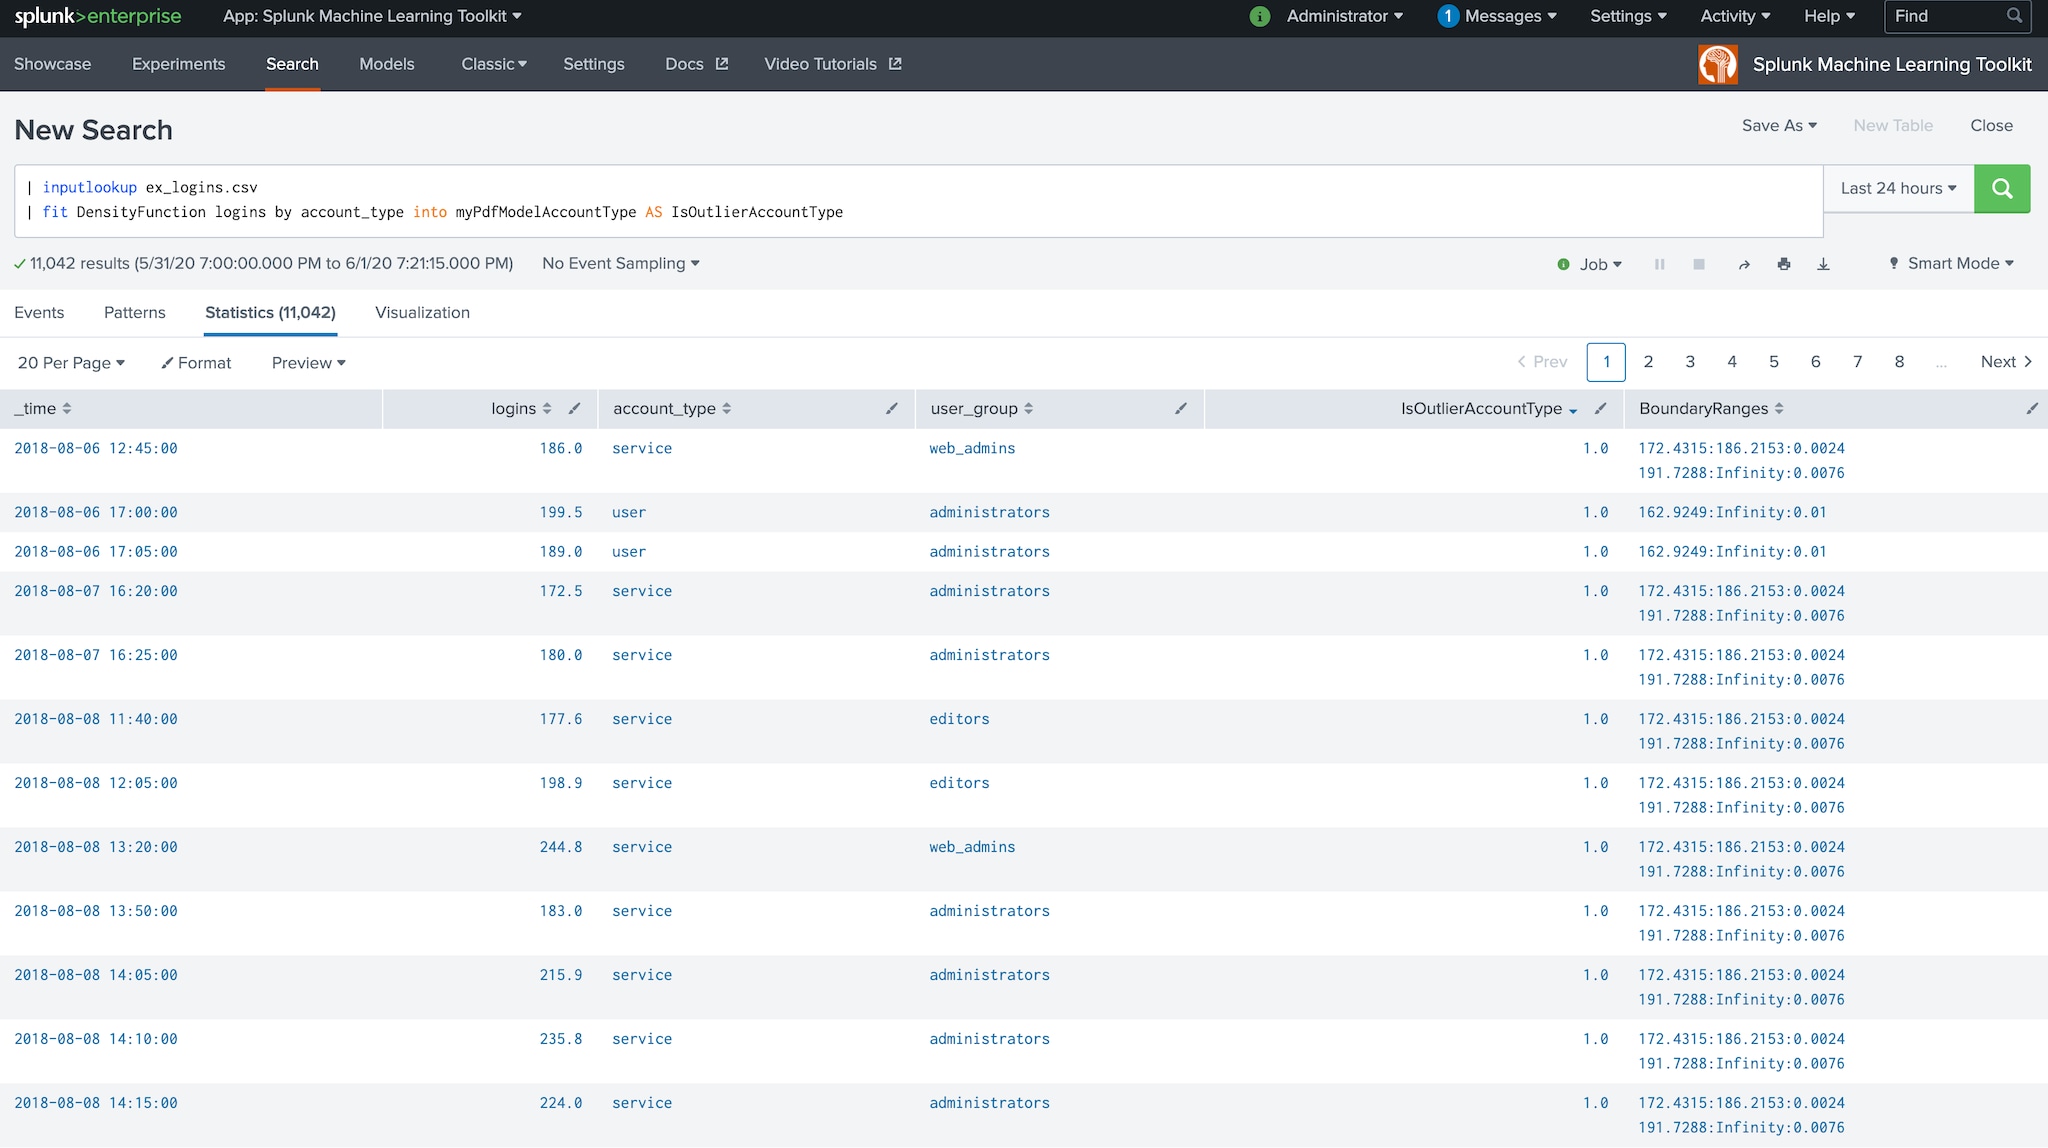
| fit DensityFunction logins by “account_type” INTO myPdfModelAccountType
AS IsOutlierAccountType
| fit DensityFunction logins by “user_group” INTO myPdfModelUserGroup
AS IsOutlierUserGroup
The above example is taking a single indicator of logins and pivoting it four different ways:
With these different splits, we now have more context around why certain values could be considered outliers, potentially detecting if we have a true anomaly. Similarly, some customers may be monitoring a very large number of servers, possibly in the thousands, in which case the algorithm could be used to split by server/user.
The Splunk Machine Learning Toolkit delivers the capability to operationalize machine learning models on your data in Splunk and the DensityFunction algorithm can be a simple starting point for users to harness the power of machine learning. In fact, customers have already started successfully using this approach in production with great results.
----------------------------------------------------
Thanks!
Mohan Rajagopalan

The world’s leading organizations rely on Splunk, a Cisco company, to continuously strengthen digital resilience with our unified security and observability platform, powered by industry-leading AI.
Our customers trust Splunk’s award-winning security and observability solutions to secure and improve the reliability of their complex digital environments, at any scale.

Get the latest articles from Splunk straight to your inbox.
© 2005 - 2025 Splunk LLC All rights reserved.