Splunk ITSI for AIOps
Discover our industry-leading approach to AIOps & monitoring.
 In case you are wondering, you're smack dab in the middle of a multi-part blog post covering Splunk IT Service Intelligence (ITSI) thresholding and alerting best practices. In the first part, we focused on KPI creation and thresholding. In this part, we're going to focus on producing and validating alerts.
KISS…again!
Alert configuration is where things can get really complicated, so keep it simple at first. Below is a list of things that will overcomplicate your alerts, so I'd recommend steering clear of them at first:
So that's it for the don’ts; let’s look at what you should be doing.
Generate an alert when a critical business service health score goes critical
Choose the smallest set of services in ITSI that are critical to your organization (avoid choosing subservices if at all possible), and create a notable event when one of those service health scores becomes critical. Create a notable event aggregation policy which triggers an alert to fire based on that notable event.
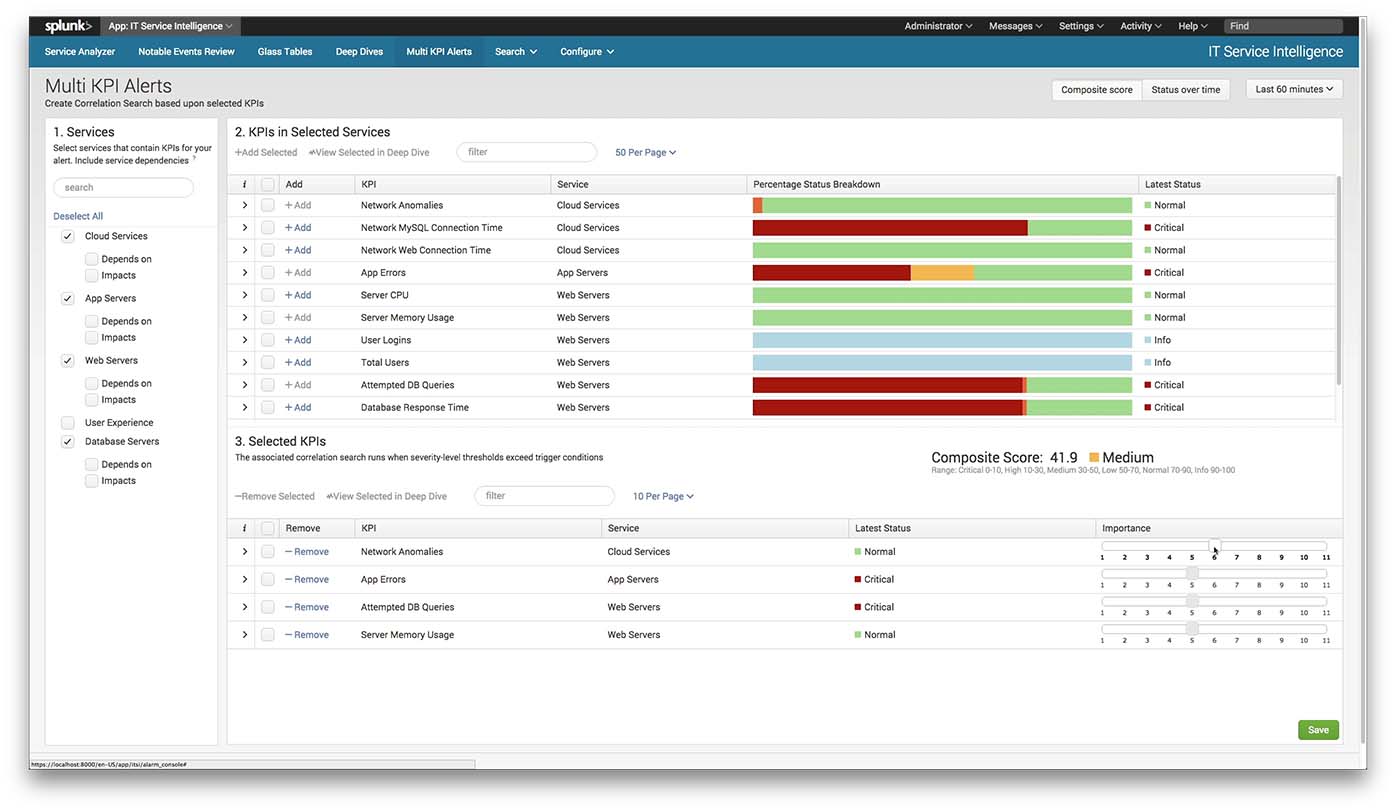
Generate an alert when a KPI within a service goes critical
Consider generating an alert when any KPI within a service enters a critical state. Again, do this by creating a notable event when certain (important) KPIs go critical, and then create a notable event aggregation policy to generate an alert from that notable event. If this is too draconian for your liking, consider a slightly more relaxed multi-KPI alert which only generates a notable event when the KPI is critical for more than 5 of the last 15 minutes.
Generate the alerts that the service team explicitly asks for
Of course, if the team consuming the alerts has specific alerting conditions they want to be notified on, then you should consider building those as well. Because of the flexibility of ITSI alerts and the unique ability of Splunk to monitor machine data, you’re likely able to enable them to produce alerts on circumstances they cannot alert on with other tools. Anything beyond this is forcing it down someone’s throat and increasing the probability of false positives.
Document configured alerts
It's best to document the alerts that you have attempted to configure per each critical service. Since traditional alerts are the culmination of several ITSI configurations, multi-KPI alerts and notable event aggregation policies (and since you'll have an increasingly larger and larger number of them as time goes on), you'll be glad you have documentation to refer back to as time goes on.
Ensure the documentation includes at least the following:
Run in “validation” mode
Unfortunately, you can’t as easily perform real-time validation of alert configurations by looking in the past as you can with KPI thresholds, so a validation period is a good idea. Spend 30-90 days running generated alerts through a validation process before trusting their configurations enough to page people out at night. Walk excessive false positive alerts backward to determine which configuration is mostly likely wrong, and refine KPI thresholds and alert configurations to reduce false positives as much as possible.
Compare ITSI alert ticket volumes with historical norms
During your validation period, you can and should ensure alert volumes from ITSI aren’t going to overwhelm the monitoring staff by comparing ITSI-generated alerts against historical norms from other tools. If you typically receive 400 tickets for service issues in a given month and ITSI has produced 100 alerts in just one day, you most likely have an alert configuration problem that you need to address. Similarly, verify that ITSI is producing alerts at the same time as other systems are indicating problems (presuming, of course, those alerts are legit).
High alert volumes doesn't necessarily mean false positives
Remember, with ITSI you're (hopefully and likely) monitoring and alerting on new types of metrics; things your organization has never been able to previously monitor. So you may very well find latent problems once you get the service monitoring up and running. Latent problems should impact computed KPI severities and subsequently produce alerts. Before tuning it out, double check to ensure it's not a legit service issue.
Well, that's it for "Part 2: Alerting Basics." It's all mostly just common sense stuff, but again, the key is to keep it simple. Start simple, gain confidence in your configurations, and expand your ITSI environment complexity gradually as the needs arise.
Ready for the next post in this series? Check out Part 3: Adaptive Thresholding.

The Splunk platform removes the barriers between data and action, empowering observability, IT and security teams to ensure their organizations are secure, resilient and innovative.
Founded in 2003, Splunk is a global company — with over 7,500 employees, Splunkers have received over 1,020 patents to date and availability in 21 regions around the world — and offers an open, extensible data platform that supports shared data across any environment so that all teams in an organization can get end-to-end visibility, with context, for every interaction and business process. Build a strong data foundation with Splunk.

Get the latest articles from Splunk straight to your inbox.
© 2005 - 2024 Splunk Inc. All rights reserved.
