
Digital Resilience Pays Off
Download this e-book to learn about the role of Digital Resilience across enterprises.
 New Relic is a popular Application Performance Monitoring (APM) solution that developers use to monitor and diagnose the performance of their code. SignalFx is integrated with New Relic so that our joint customers can get more out of their APM metrics, bringing them into the context of behavior and performance from every part of the stack. New Relic customers who connect to SignalFx can take advantage of SignalFx’s real-time analytics, alert detectors and broader view of the environment.
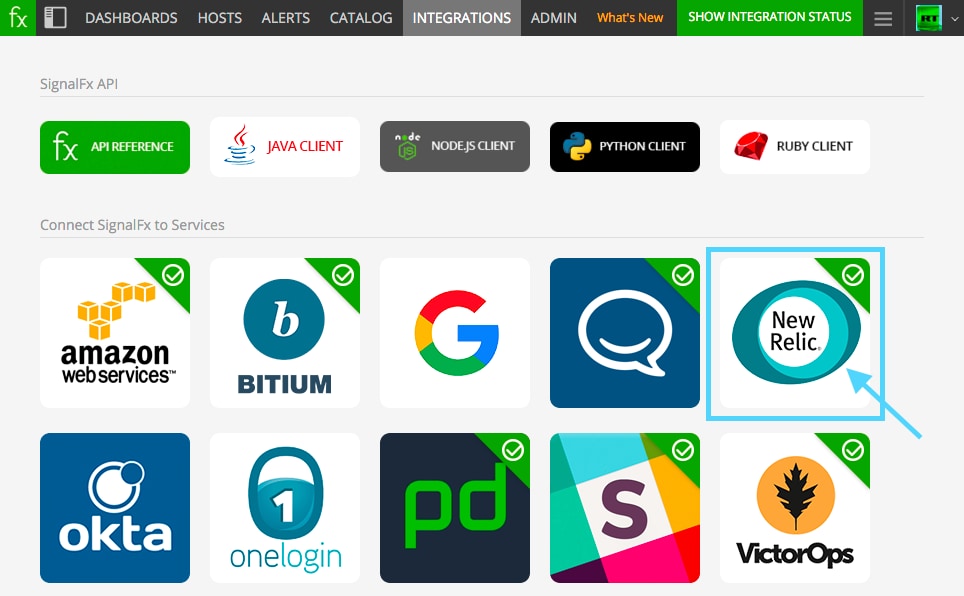
 To get started with New Relic metrics in your SignalFx organization, just select the New Relic Integration from the Integrations tab.
Add your New Relic API token (or multiple tokens if you have multiple accounts that you’d like to get metrics from) and connect. You’ll see New Relic metrics appear in SignalFx within minutes.
To pull in data from New Relic’s API, we first obtain the list of metrics with available data points, then make a second API call to get available metric values. New Relic recently upgraded their API to make the results from these two endpoints more consistent, making the results much smoother.
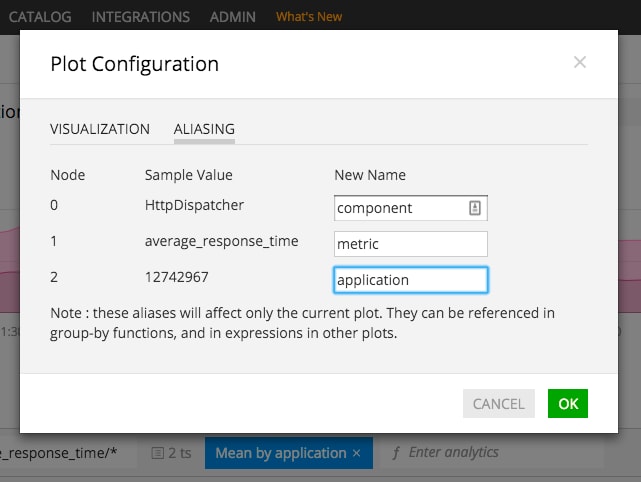
 Next, we make a few changes to the metric names that come back from the API. Metric names from different New Relic modules are constructed using different patterns, so they can’t be reliably transformed into dimensions. Instead, New Relic customers in SignalFx can use components of metric names as dimensions on-the-fly while building charts. We call this capability “node aliasing“. To make this as smooth as possible, we ensure that all the information that you might use to filter or aggregate your data is included in the name of the metric itself. To the end of each metric name we add the application or server ID that it’s describing, and to the beginning of each Servers metric name we add its account ID.
We created a chart-building mode specifically for New Relic data that lets New Relic customers take full advantage of SignalFx dimensions, filters and analytics. Called “New Relic wildcard mode”, this feature performs wildcard searches for metrics delimited by the slash “/” character. For example, the Apdex score for application 12742967 is given by a metric that looks something like this:
Apdex/score/12742967
To see the Apdex scores for that endpoint in all applications, search using New Relic wildcard mode like this:
Apdex/score/*
Read more about New Relic wildcarding mode here.
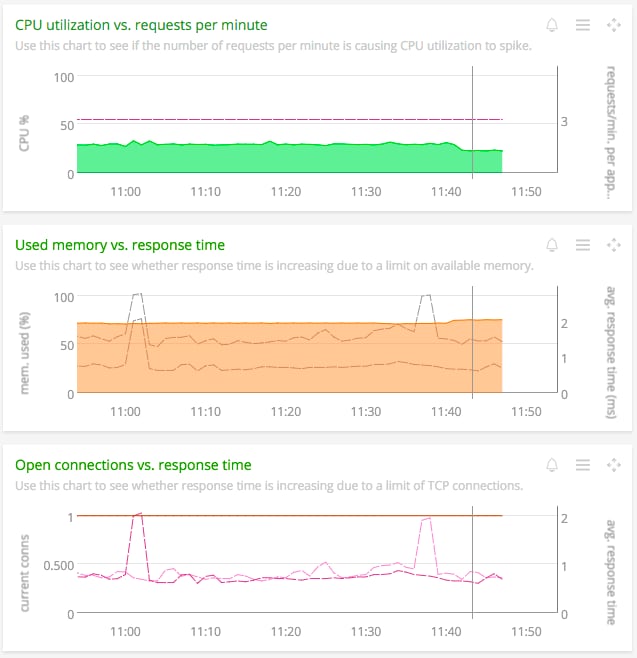
Best of all, if you install the SignalFx collectd agent on the same servers that host your New Relic-instrumented applications, you’ll be able to connect New Relic’s stellar applications data with SignalFx’s high-resolution, real-time infrastructure data. Read more about combining data from all levels of your stack here.
At SignalFx, timeliness and correctness of data is the top priority, and there are a few idiosyncrasies to the API that all New Relic users should be aware of. We’ve done our best to accommodate and we hope these inconsistencies will be resolved soon. Until then, here are some limitations you should know about:
----------------------------------------------------
Thanks!
rt

The Splunk platform removes the barriers between data and action, empowering observability, IT and security teams to ensure their organizations are secure, resilient and innovative.
Founded in 2003, Splunk is a global company — with over 7,500 employees, Splunkers have received over 1,020 patents to date and availability in 21 regions around the world — and offers an open, extensible data platform that supports shared data across any environment so that all teams in an organization can get end-to-end visibility, with context, for every interaction and business process. Build a strong data foundation with Splunk.

Get the latest articles from Splunk straight to your inbox.
© 2005 - 2024 Splunk Inc. All rights reserved.
