
Digital Resilience Pays Off
Download this e-book to learn about the role of Digital Resilience across enterprises.
We are excited to announce that Splunk has partnered with AWS in launching a new AWS Service Ready program – Lambda Ready. This designation recognizes that Splunk provides proven solutions for customers to build, manage and run serverless applications. AWS Lambda Ready designation establishes Splunk as an AWS Partner Network (APN) member that provides validated integrations and proven customer success with a specific focus on observability and monitoring of Lambda Functions.
Organizations are adopting Lambda Functions to rapidly deliver new features, focus on their customers and accelerate innovation. Serverless architectures provide the following advantages:
These benefits have propelled the use of serverless technologies among enterprises in every industry. According to Gartner, by 2021, 90% of enterprises using IaaS will also have some serverless applications in production. The latest CNCF survey cites that at least 41% of organizations are currently using serverless.
While Lambda enables companies to increase the pace of software innovation and control cost, it also presents its own set of monitoring and observability challenges:
When you invoke a Lambda function, the request is processed in a new container environment. When a function has not been executed for some time or when you need to process more concurrent requests, AWS Lambda will start a new environment to execute your functions. The initialization of the runtime and your code leads to additional latency. This latency is usually referred to as a cold start. If you have several Lambda function invocations in a chain, latencies add up and result in poor user experience. In fact, a study conducted by Akamai shows that every 100-millisecond delay in website load time can hurt conversion rates by 7%. Since Lambda functions are billed for the duration in milliseconds, your AWS cost can easily balloon up if latencies are not managed. Real-time visibility into latency is required to control cost and deliver a flawless user experience.
Splunk solutions enable DevOps teams to easily understand the performance, usage and bottlenecks across the entire application spectrum. Whether your applications consist of 100% serverless or a mix of serverless and traditional apps, you can monitor your entire cloud stack with Splunk in real-time.
A pre-built dashboard with key metrics across all serverless functions provides a bird’s eye view to understand how your serverless architecture is performing. Quickly search, filter, and sort to drill down into functions with errors, high latency, or cold starts. Tag and group functions based on usage, location, account, runtime, resources, or any other dimension.
To avoid cold starts, development teams can use the Provisioned Concurrency feature. Functions can instantaneously serve a burst of traffic with consistent start-up latency. However, you pay for the amount and the duration of provisioned concurrency. It is critical to understand how much of provisioned concurrency is used and the percentage of spillovers. Our pre-built dashboards give deeper insights into cold starts, concurrency, throttles and spillovers to manage under-provisioned functions, optimize latency and reduce cost.
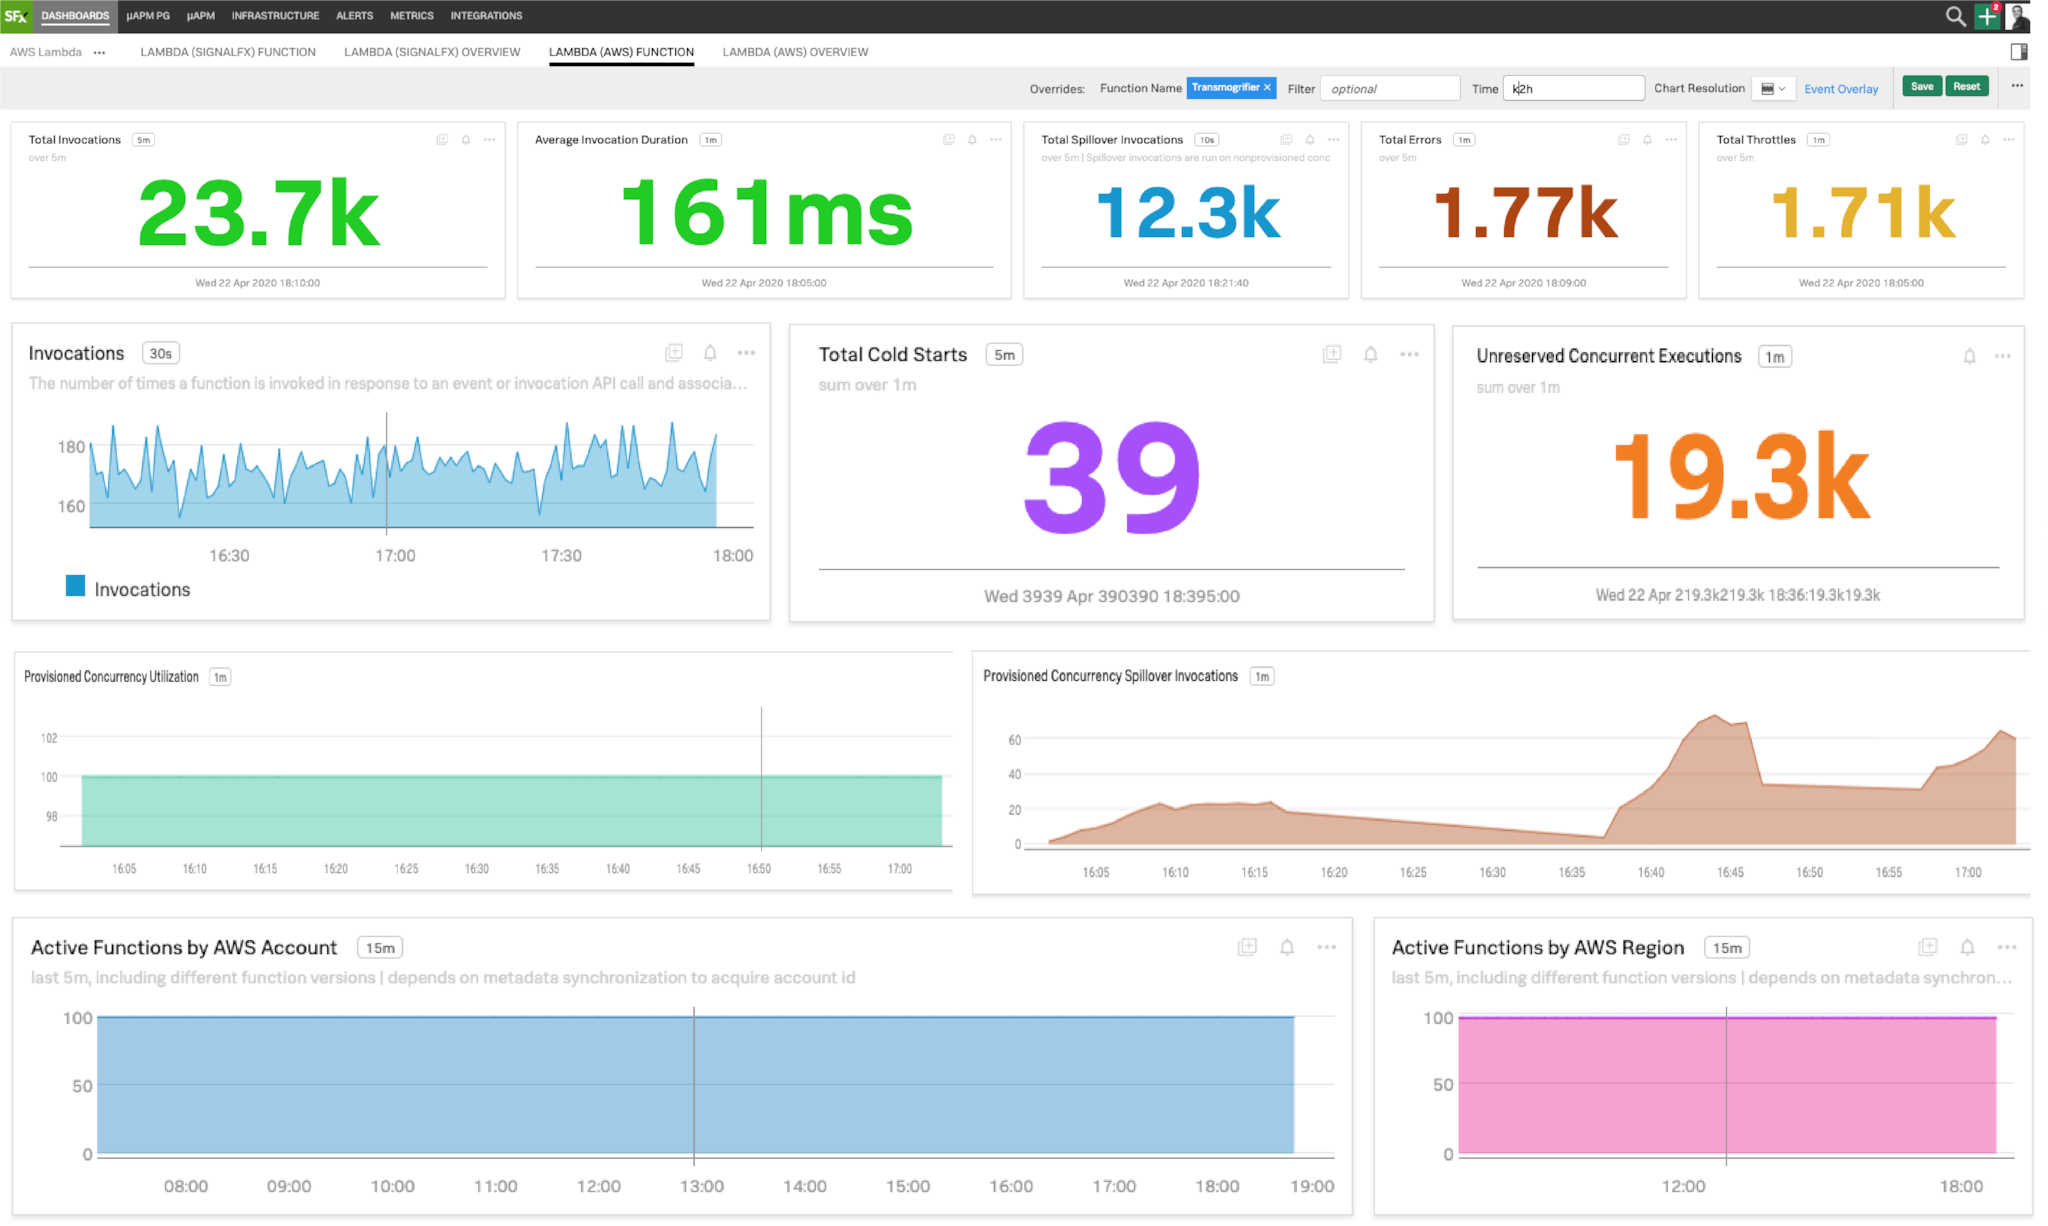
The above chart shows the opportunities to increase the provisioned concurrency as spillovers are high, provisioned concurrency utilization is 100% and we are observing cold starts with high duration.
Visualize your services and their dependencies with automatic service maps created by Splunk Application Performance Monitoring (APM) based on real-time data interactions between your services – serverless functions, traditional apps, third party APIs, database calls, etc.
Get granular details on every transaction with trace view. Splunk APM captures every transaction across all services with NoSample full-fidelity trace ingestions to analyze every trace.
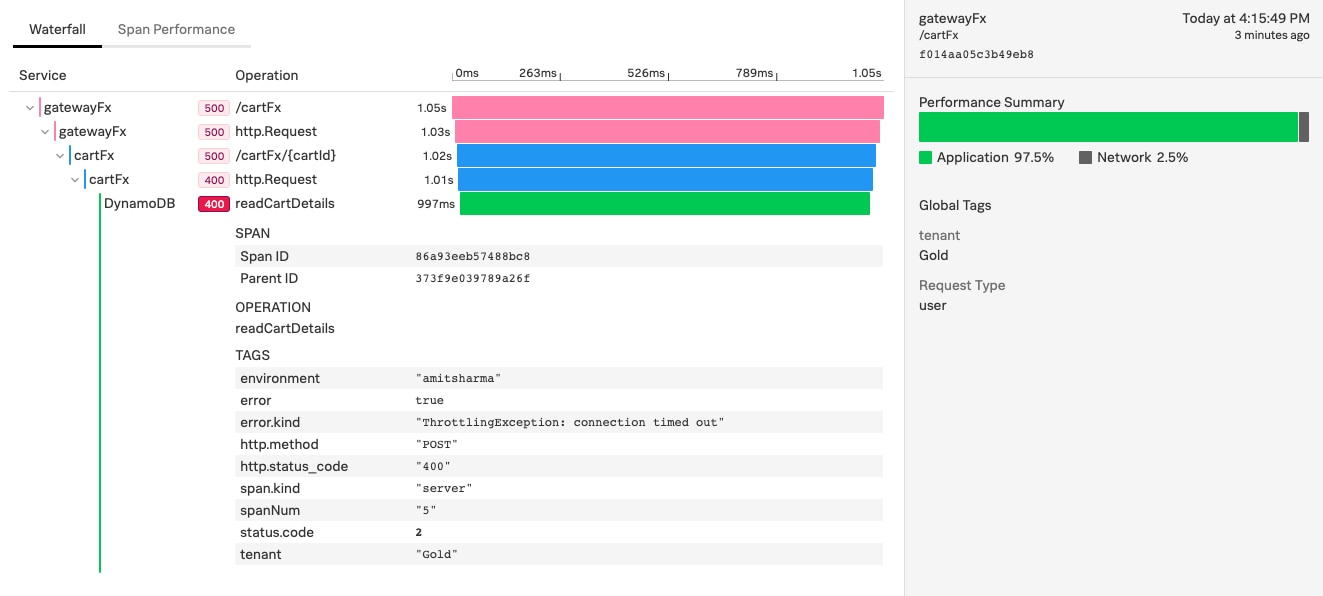
Use open-source tracing libraries to instrument code in most popular languages and leverage automatic instrumentation for common frameworks.
For situations when you need to track function invocations or errors at a level more granular than what CloudWatch can deliver, we provide a function wrapper that includes calls to Splunk with the count of invocations and errors, the execution duration and cold starts. You get real-time insights with wrappers within seconds while CloudWatch Lambda metrics, with a standard resolution, are available with at best 1-minute, typically 5-minutes+ resolution.
We currently provide Lambda wrappers in Node.js, Java, Python, Ruby, Golang, and C#. You can either choose Splunk request handlers to use wrappers out-of-the-box or manually instrument your code.
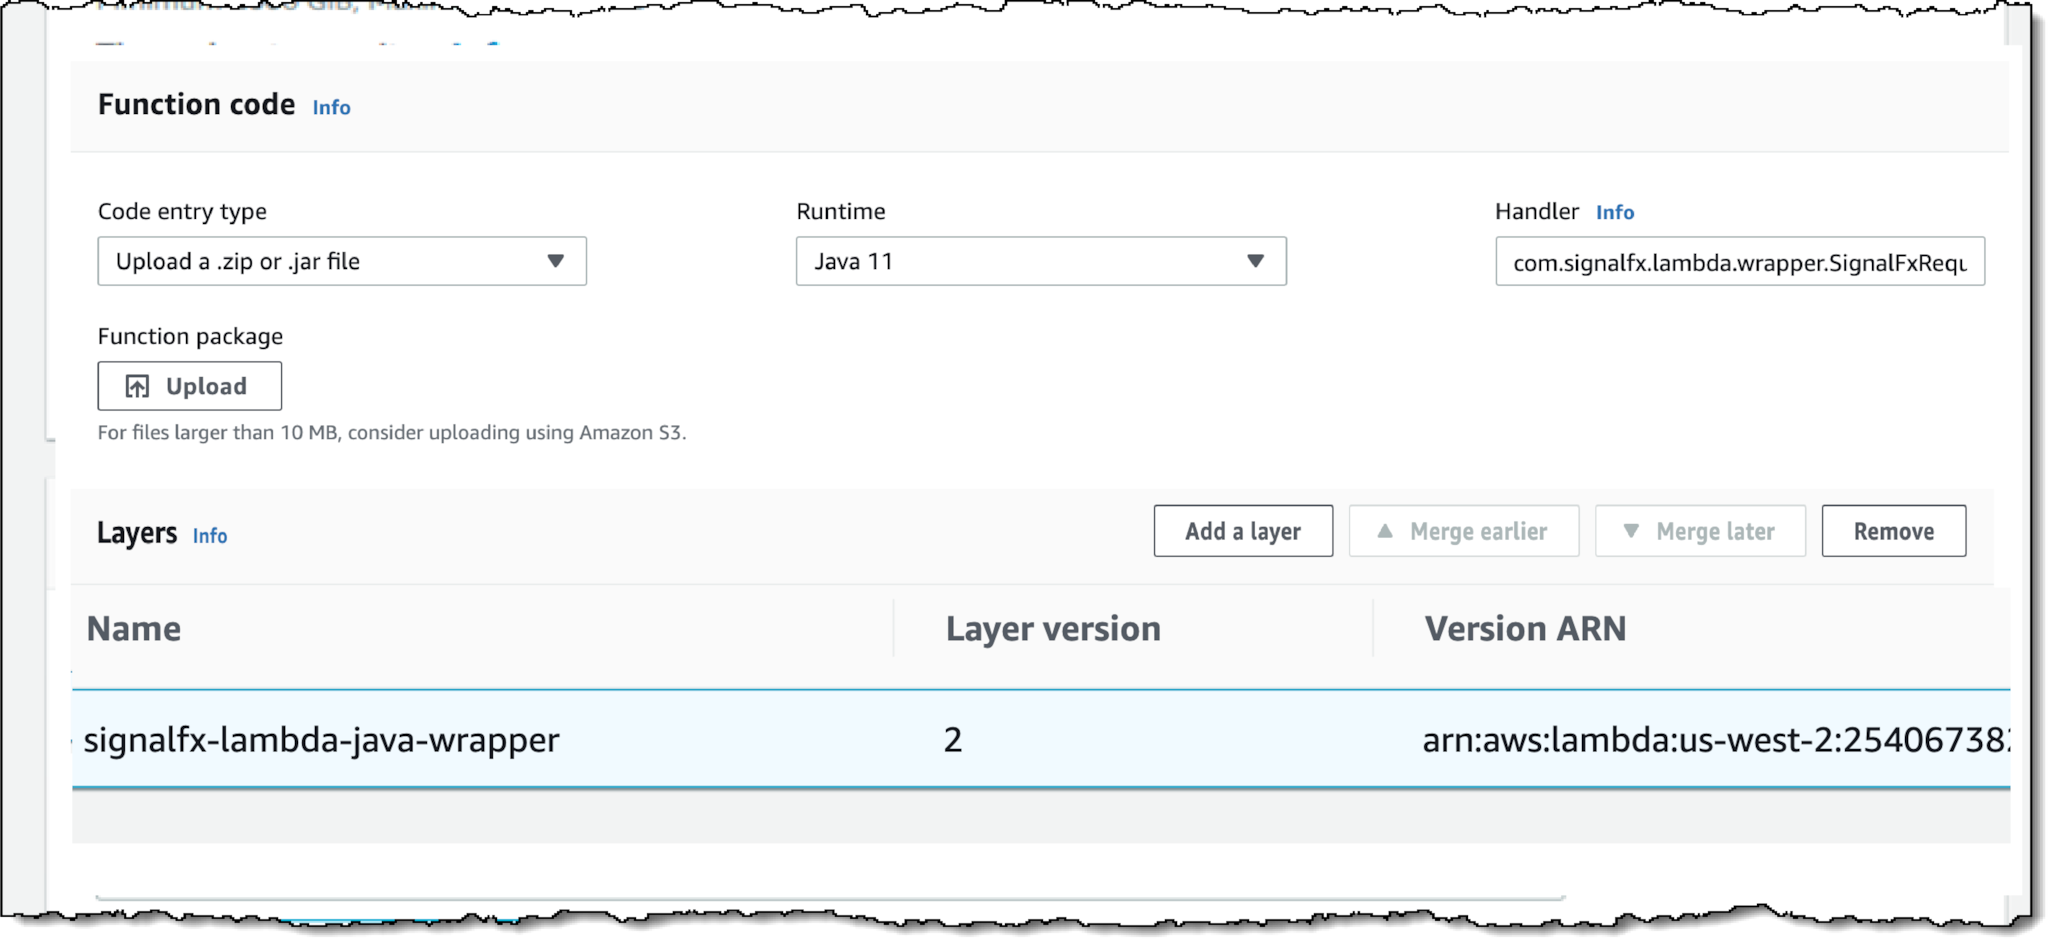
To reduce the size of your functions, streamline dependency management and simplify upgrades of your functions, you can use language-specific Lambda Layers hosted by Splunk in your AWS region.
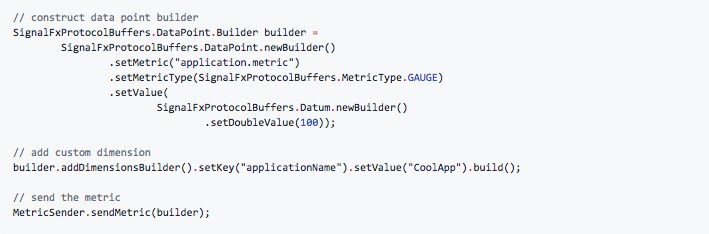
Wrappers also provide an easy mechanism to instrument your code for custom metrics that matter, e.g. business KPIs – simply add a few additional lines within your function to capture and send those metrics to Splunk without incurring any performance overhead.
We are excited to partner with AWS and looking forward to accelerating the journey to serverless for our joint customers. Future-proof your observability investment with an enterprise-grade solution trusted by enterprises for most advanced use cases at a massive scale. Serverless Monitoring is included with Splunk Infrastructure Monitoring. Get started with a free trial today.
----------------------------------------------------
Thanks!
Amit Sharma

The Splunk platform removes the barriers between data and action, empowering observability, IT and security teams to ensure their organizations are secure, resilient and innovative.
Founded in 2003, Splunk is a global company — with over 7,500 employees, Splunkers have received over 1,020 patents to date and availability in 21 regions around the world — and offers an open, extensible data platform that supports shared data across any environment so that all teams in an organization can get end-to-end visibility, with context, for every interaction and business process. Build a strong data foundation with Splunk.

Get the latest articles from Splunk straight to your inbox.
© 2005 - 2024 Splunk Inc. All rights reserved.
