
Digital Resilience Pays Off
Download this e-book to learn about the role of Digital Resilience across enterprises.
The CDC – like most government bodies the world over – are starting to make more, and more data publicly available to advance research.
In January the CDC posted a blog post (since deleted) challenging the public to work with their Vital Stats datasets, including both birth and mortality data.
Over the coming weeks I’m going to post some of my findings (and workings) from analysing these datasets alongside other sources including weather and employment, all in Splunk.
In an optimistic mood I started with birth data.
With the boring stuff  Just some context:
A simple search to warm up.
| eval theYear = strftime(_time, "%Y")
 | stats count AS totalBirths by theYear
 | fieldformat totalBirths=tostring(totalBirths,"commas")
 | fields totalBirths theYear
 | addtotals fieldname totalBirths row=false col=true
Starting with a nice eval to pull out the year using strftime. I then counted births by year, and used fieldformat to make the resulting count easier to read by adding commas. As we counted births by year using the first stats, I also summed the totalBirths column using addtotals.
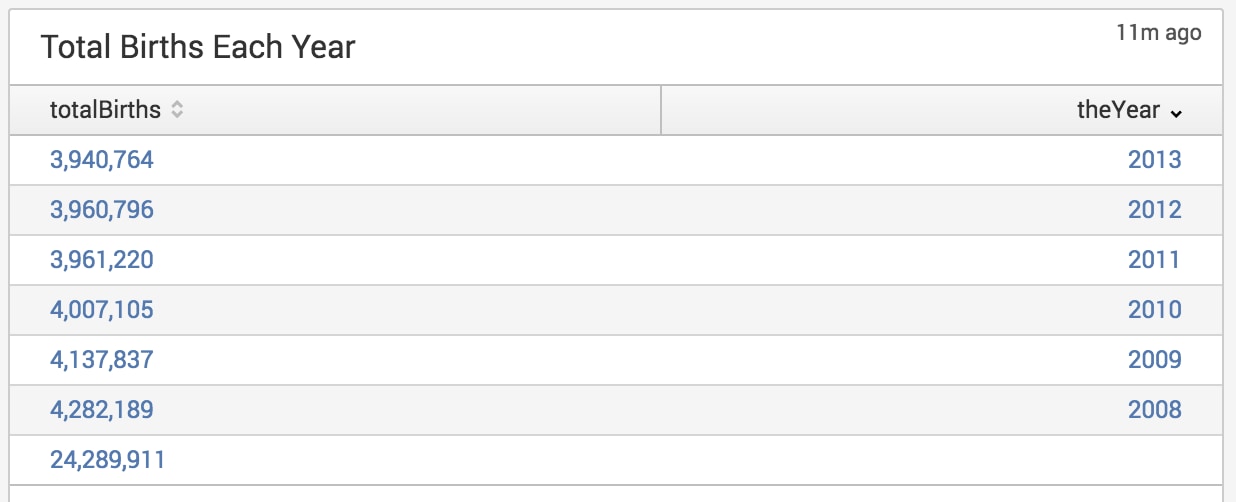
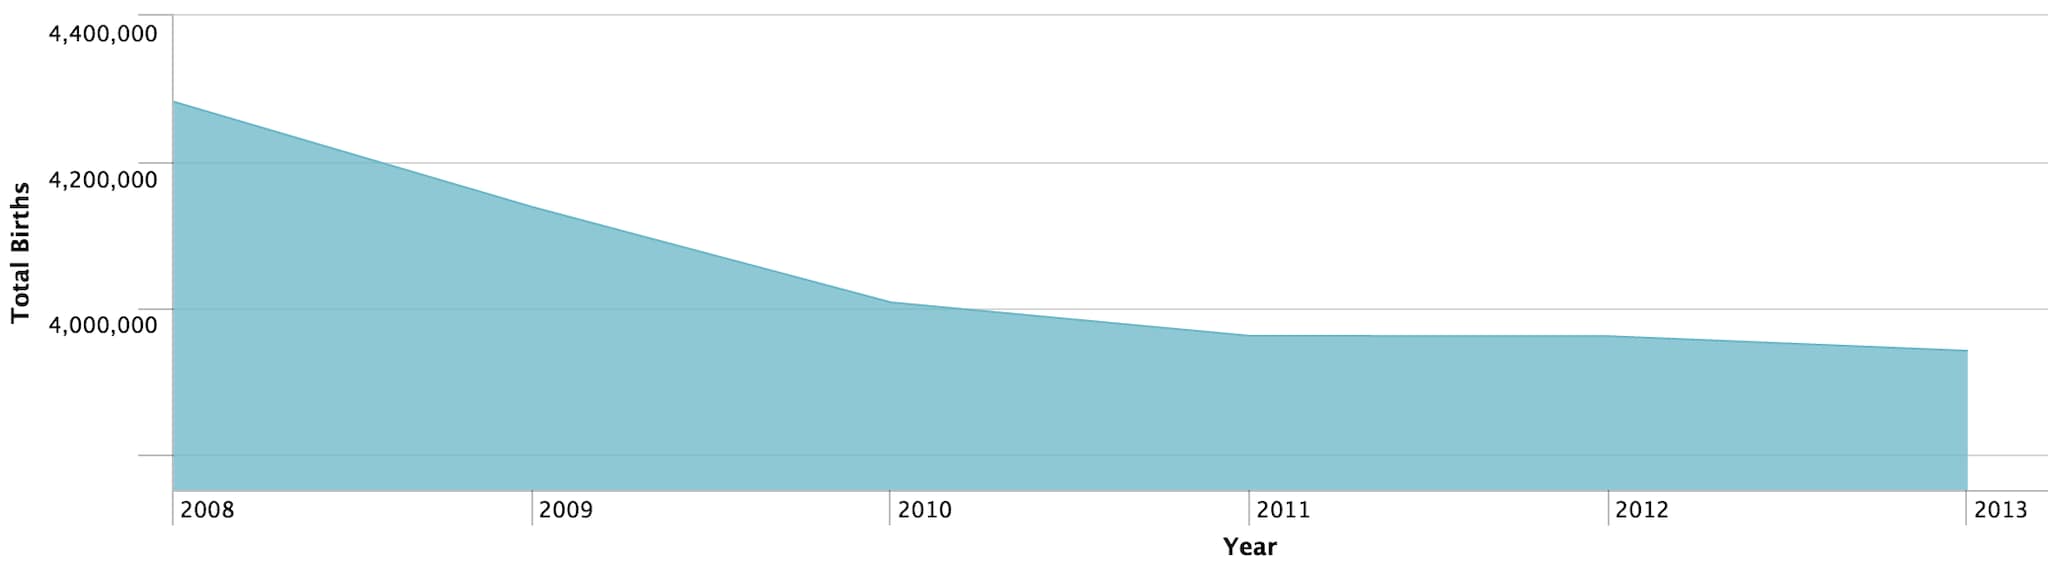
There were almost 25 million births between 2008 – 2013, with total births declining year-on-year. Births dropped by over 140,000 between 2008 – 2009!
This is particularly poignant (and scary) to me. As a 26-year old with a mother asking when I’ll be settling down I need some data to argue my point that, “I’m not ready yet!”.
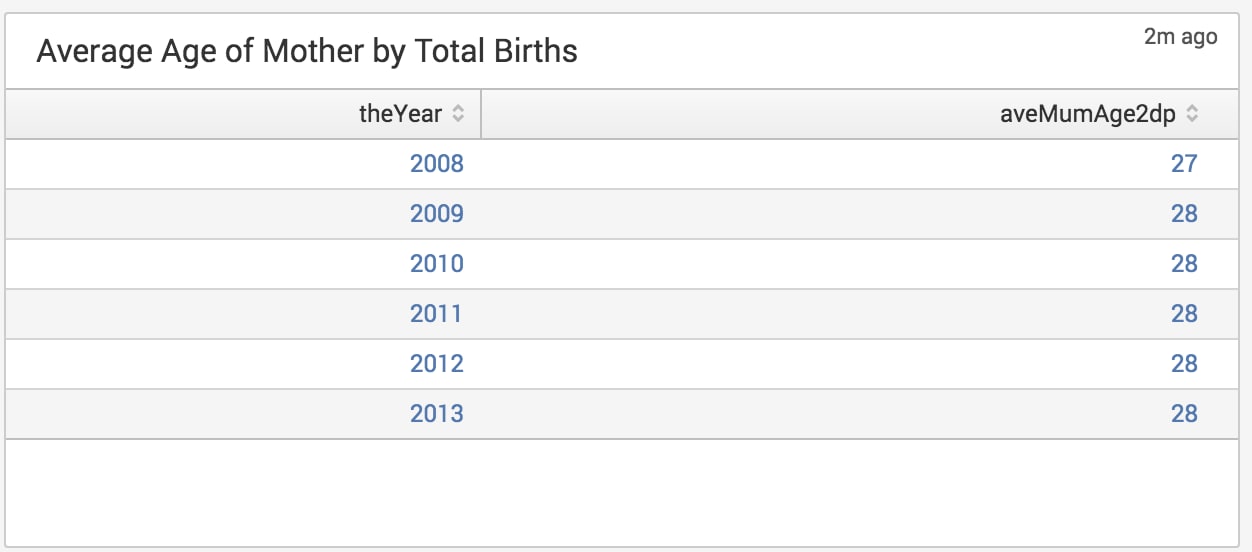
Lets use a search to display the average age of mothers for each calendar year.
| eval theYear = strftime(_time, "%Y")
 | stats avg(MAGER_) AS aveMumAge BY theYear
 | eval aveMumAge2dp=round(aveMumAge,0)
 | fields theYear, aveMumAge2dp
Working this search through: the stats function gives us the mean average for each year, and finally we use an eval to round the years to whole numbers.
Or, how long do I have left before I need to bear young?
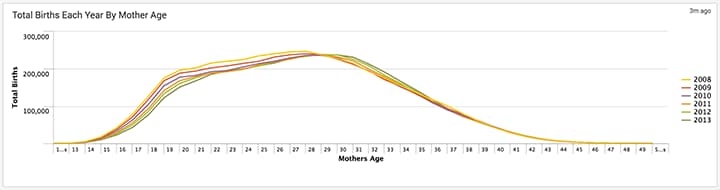
| eval theYear = strftime(_time, "%Y")
 | chart count by MAGER_, theYear
A simple chart command counting by the mothers age field against the calculated year field gives us the answer.
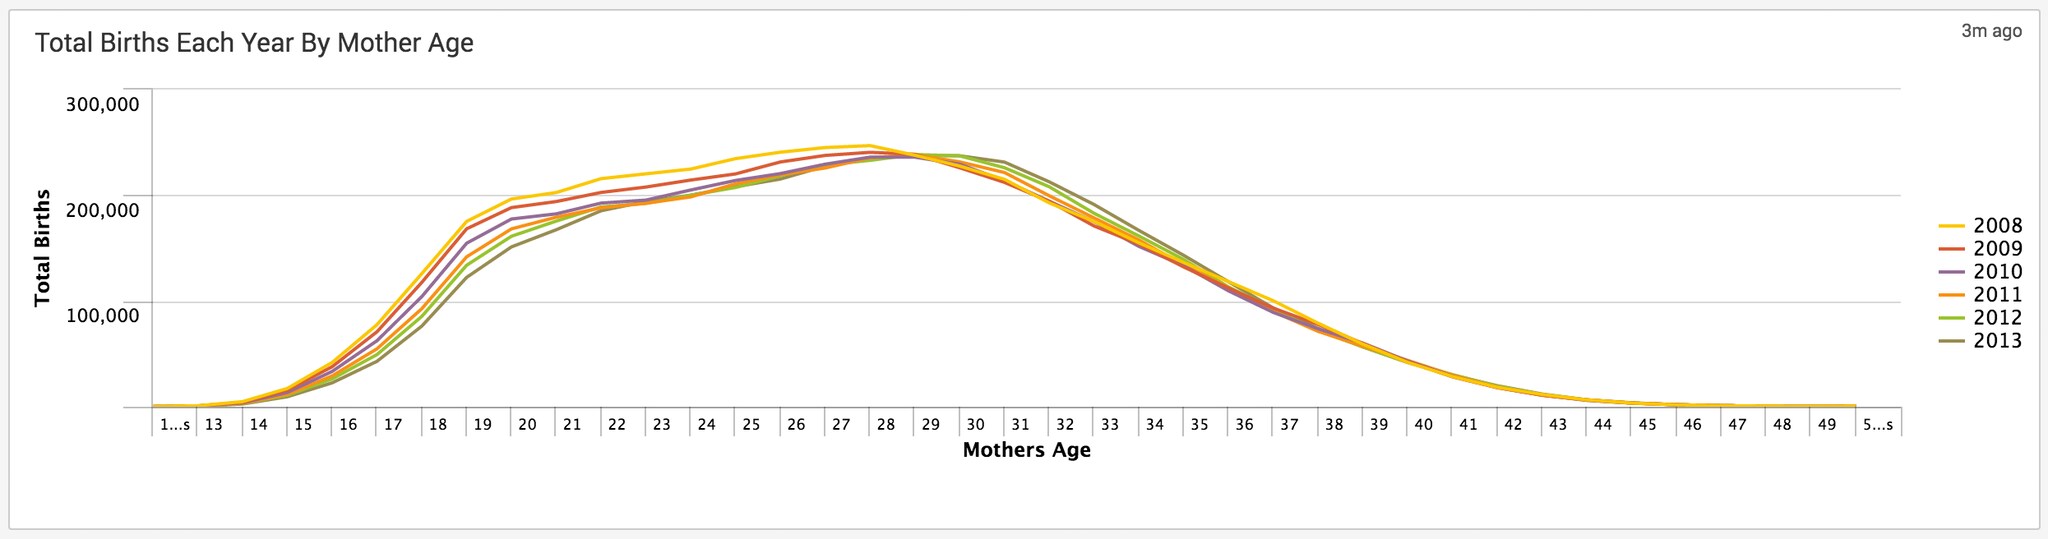
You can clearly see most births are to mothers between ages 18-34, which fits with what many doctors recommend.
Some of my friends have started having kids. Until I looked at this dataset I had no idea what the “normal” weight of a newborn was. Anyone with me?
However, I was most interested in comparing birth weight to mothers weight after my mother declared upon hearing I was doing this research that she was “underweight when she fell pregnant” with me. Should I be worried? Search, please.
| eval DBWTkg=(DBWT/1000)
 | chart avg(DBWTkg) BY BMI_R_
 | sort -avg(DBWTkg)
I used the BMI_R_ field to chart infant weight against mothers BMI before pregnancy, as apposed to using the raw mothers weight field also found in the dataset. The reason for using BMI is that it is a more accurate indicator of healthy weight of mother – i.e taller mothers will be heavier, but not necessarily overweight.
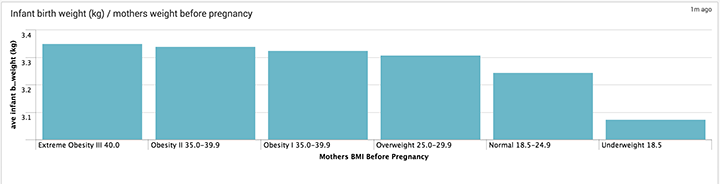
The fatter the mother, the heavier the baby. Though as can clearly be seen, mothers who are underweight before pregnancy give birth to children almost 200 grams lighter than mothers of normal weight.
| eventstats count AS "totalCount" by BMI_R_
 | search ILIVE=N | eventstats count AS "iliveCount" by BMI_R_
 | eval percent=(iliveCount/totalCount)*100
 | stats values(iliveCount), values(percent) by BMI_R_
 | fields BMI_R_ values(iliveCount) values(percent)
 | sort -values(percent)
To do this we need to baseline number of births against BMI to provide an accurate percentage risk of infant mortality. I use eventstats to do a total count, immediately followed by a search using the ILIVE=N field=value (N = infant dead at time of report). We then use an eval to work out percentage risk.
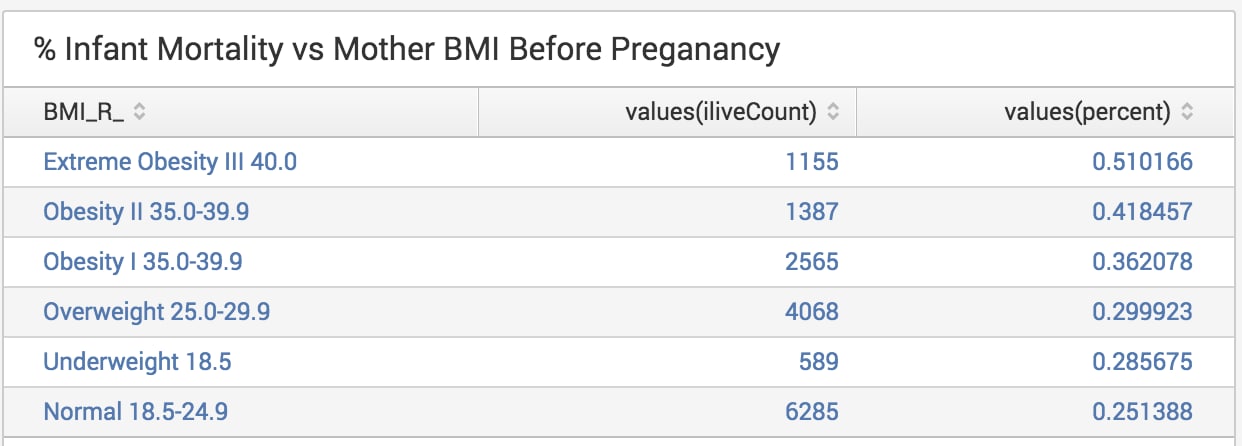
Whereas we might infer underweight mothers to have the highest infant mortality from the result of the last search, it is in fact overweight mothers who suffer the highest infant mortality. An infant is over twice as likely to die during birth if a mother is classified as “Extremely Obese” compared to a mother of “Normal Weight”.
Thankfully my mother does not smoke. I’m not preaching here, I’ll let you draw your own conclusions.
| eval smoker=(CIG_1+CIG_2+CIG_3)*100-CIG_0
 | eval smokerPregnancy=case(smoker=0, "Non-smoker", smoker>0 , "Smoker (Before and During Pregnancy)", smoker | eval DBWTkg=(DBWT/1000)
 | chart avg(DBWTkg) BY smokerPregnancy
 | sort -avg(DBWTkg)
I used two eval statements for this search. The first performs a calculation so I can determine wether someone smoked before and/or during pregnancy. The CIG_0 field reports the number of daily cigarettes smoked by the mother before pregnancy. The CIG_1-3 fields report the number of cigarettes smoke daily during the respective trimester by the mother. The resulting values is then used in the second eval to calculate at what stage a mother smoked, if at all.
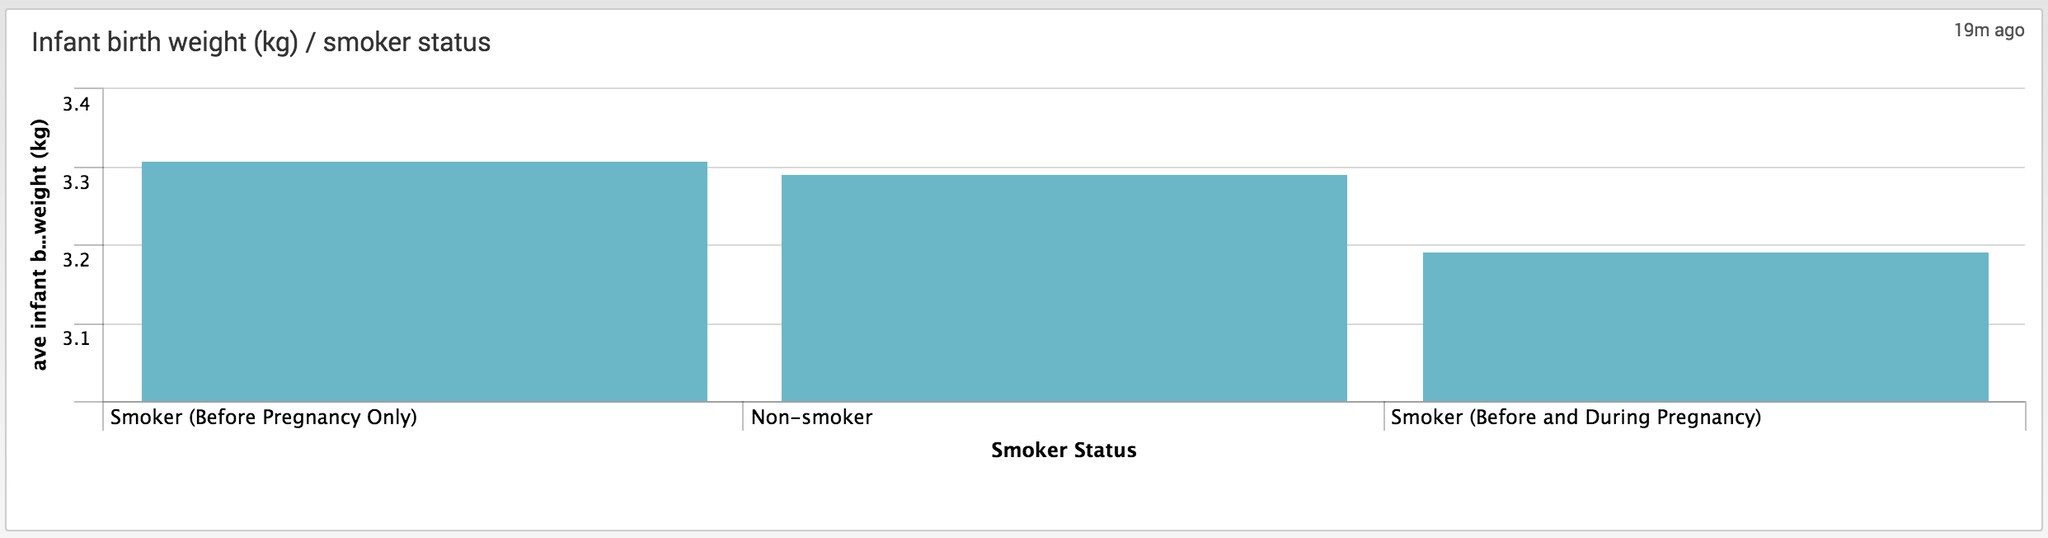
Perhaps as expected, mothers who smoke during pregnancy generally have smaller infants (average 100 grams lighter than non-smokers during pregnancy).
| RENAME UCA_DOWNS_ AS NORM_DOWNS CA_DOWN_ AS NORM_DOWNS
 | eventstats count AS "totalCount" by BMI_R_
 | search NORM_DOWNS=Yes
 | eventstats count AS "downsCount" by BMI_R_
 | eval percent=(downsCount/totalCount)*100
 | stats values(downsCount), values(percent) by BMI_R_
 | fields BMI_R_ values(percent)
 | sort -values(percent)
The first function in this search is a rename. The CDC datasets report the same fields differently over different years. In the above search during the years search, both UCA_DOWNS and CA_DOWNS are referencing wether the infant has been diagnosed with Downs Syndrome. We normalise these fields into one (NORM_DOWNS) using the rename. The stats function is used to calculate the percentage risk of Downs Syndrome against mothers BMI before pregnancy.
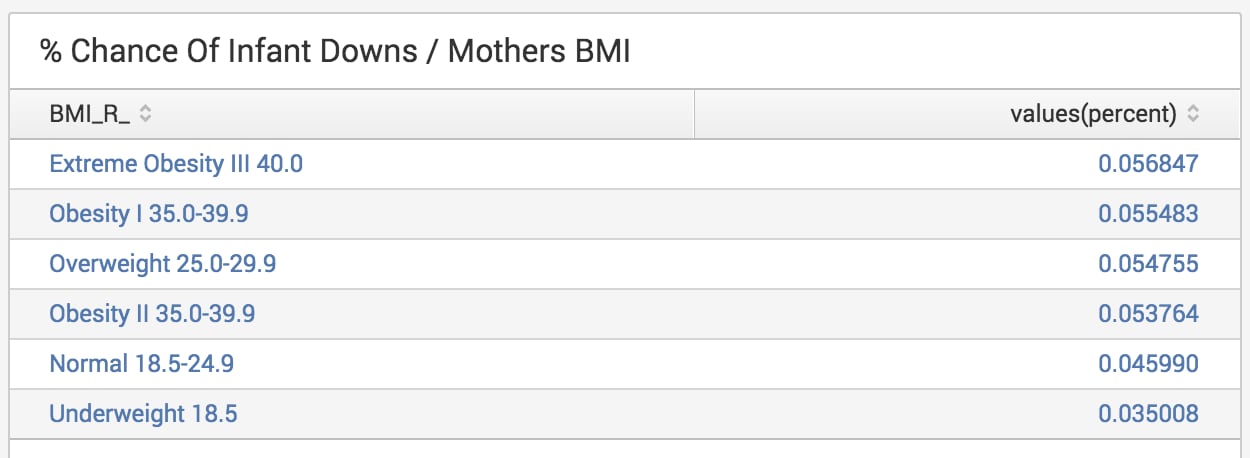
It would appear that obesity has a close relationship to Downs Syndrome. With even mild obesity significantly increasing the risk to newborns.
Awesome. If you want to play with this data I have put my conf files into a Splunk App available on Github. All you need to do is load in the data. There are hundreds of fields to pivot on, I have only shown a handful above.
The version at the time of posting was used for this analysis. Please note, this app has not been fully tested yet (currently works for datasets up to 2001). I stress this is a very early version offered to those who want to help with its development. Hint, hint
In part 2 we’ll explore custom visualisations, and more advanced searches. Stay tuned.
----------------------------------------------------
Thanks!
David Greenwood

The Splunk platform removes the barriers between data and action, empowering observability, IT and security teams to ensure their organizations are secure, resilient and innovative.
Founded in 2003, Splunk is a global company — with over 7,500 employees, Splunkers have received over 1,020 patents to date and availability in 21 regions around the world — and offers an open, extensible data platform that supports shared data across any environment so that all teams in an organization can get end-to-end visibility, with context, for every interaction and business process. Build a strong data foundation with Splunk.

Get the latest articles from Splunk straight to your inbox.
© 2005 - 2024 Splunk Inc. All rights reserved.
