Transitioning From Graphite to Splunk Infrastructure Monitoring

In my previous post, "How to Level Up From Graphite," I shared some of the reasons organizations are transitioning from Graphite monitoring to a more modern monitoring-as-a-service solution like Splunk Infrastructure Monitoring. Specifically, where Graphite (and its ilk) has limitations in scale, maintenance, ease of use, flexibility, and cost, Splunk Infrastructure Monitoring was built specifically for today’s distributed, elastic environments that rely on faster, more durable insights that enable intelligent, real-time alerting.
Ultimately, as organizations move to the cloud and adopt DevOps metrics and strategies, they need monitoring that both grows with their needs and offers the best features of familiar systems like Graphite. Splunk Infrastructure Monitoring has invested in a number of capabilities that dramatically simplify the transition from Graphite, enabling Graphite users to:
- Use familiar Graphite wildcard conventions while building charts in Splunk Infrastructure Monitoring
- Take advantage of Splunk Infrastructure Monitoring's multidimensional analytics without modifying incoming Graphite metrics, through on-the-fly dimension aliasing
- Translate existing Graphite metrics to dimensionalized Splunk Infrastructure Monitoring metrics at scale with the Splunk Infrastructure Monitoring metric proxy
Support for Graphite Wildcard Conventions
Many Graphite users have become accustomed to its wildcard conventions, and use them actively to generate the custom charts that they want. Splunk Infrastructure Monitoring supports the use of those conventions in the signal (metric or event) field of the Splunk Infrastructure Monitoring chart builder UI, including asterisks, character lists and ranges, or value lists. To use the Graphite wildcard, simply enter the syntax into the signal field, then select the Graphite wildcard option.

On-the-Fly Dimension Aliasing
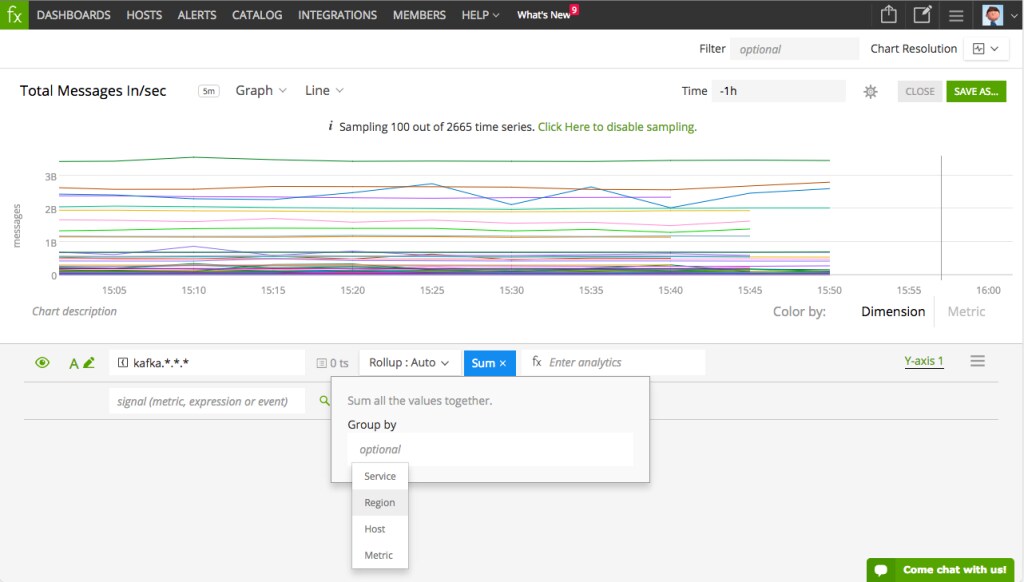
One of the most powerful features in Splunk Infrastructure Monitoring is the ability to use dimensions to filter or group everything: metrics, charts, dashboards, alerts, and the Host Navigator. For example, you can filter in or out time series that match "datacenter:snc" or calculate the average value of the metric "cpu.total.user" across multiple hosts, grouped by microservice.
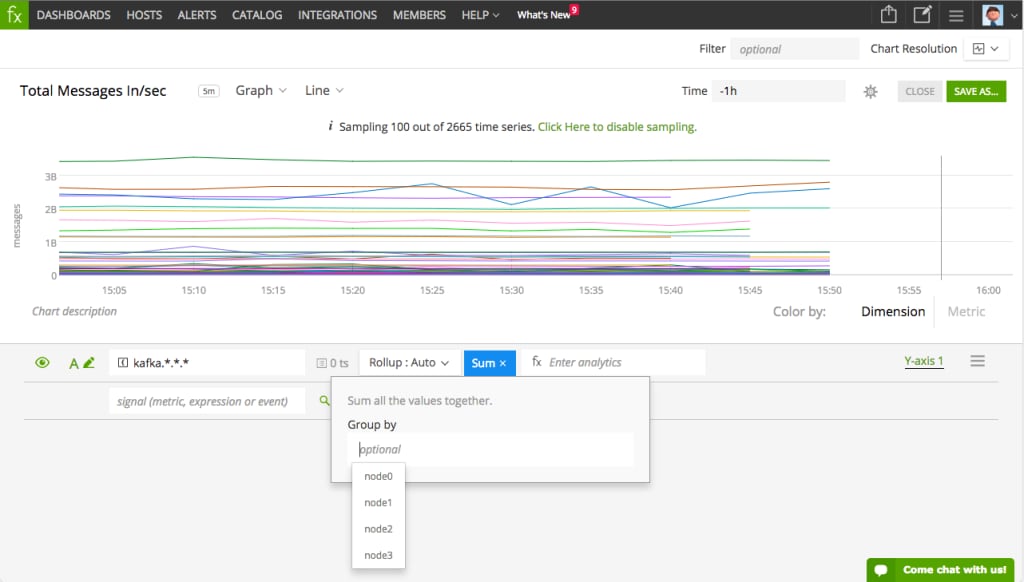
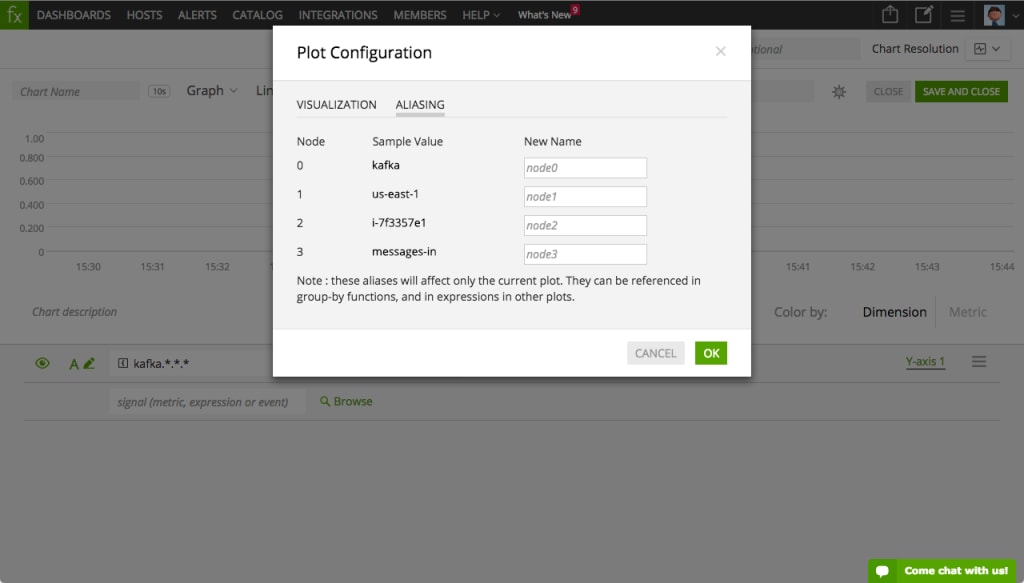
In Graphite, metric names typically contain multiple dot-separated dimension values, such as "snc.role1.server3.cpu.total.user". (The dimension keys—e.g., datacenter, role, host—are implicit.) To use the dimensions in Graphite metric names as if they were native Splunk Infrastructure Monitoring dimensions, you can simply apply on-the-fly dimension aliasing to the chart you’re constructing. This allows you to treat the nodes in a Graphite metric name as if they were dimensions in Splunk Infrastructure Monitoring, and you can also assign aliases to the implicit dimension keys to make it easier to use and easier to understand.


Splunk Infrastructure Monitoring Metric Proxy
The Splunk Infrastructure Monitoring metric proxy is a multilingual datapoint demultiplexer that can accept time series data from a variety of metrics protocols and emit those datapoints to one or more servers on the same protocols. It is designed to be used in the following scenarios:
- You are using a metrics monitoring system like Graphite in production and want to evaluate Splunk Infrastructure Monitoring in a non-disruptive way
- You have decided to use Splunk Infrastructure Monitoring, but you have a mechanism for collecting metrics (typically an agent or other client-side code) that does not yet have a native Splunk Infrastructure Monitoring backend or handler
- You limit the number of egress points from your network due to security or other concerns, and you want to consolidate metrics-related traffic as it leaves your network
To try out Splunk Infrastructure Monitoring, you can place the proxy in between collectors and Graphite. In other words, collectd, StatsD, and other agents and/or client libraries send their metrics to the proxy, which then forwards it on to both Graphite and Splunk Infrastructure Monitoring. (When you are ready to make the switch, Splunk Infrastructure Monitoring will ingest those metrics directly.)
In the simplest case, Graphite metric names are forwarded as-is and appear in Splunk Infrastructure Monitoring with the traditional dot-separated format. When you decide to leverage Splunk Infrastructure Monitoring's dimension-based capabilities across the board (as opposed to on a per-chart basis, as with on-the-fly dimension aliasing) you can add a schema to the proxy that will parse the Graphite metric names into dimensionalized Splunk Infrastructure Monitoringmetrics. Learn more about the metric proxy.
Get visibility into your entire stack today with a free 14-day trial of Splunk Infrastructure Monitoring.
Related Articles
About Splunk
The Splunk platform removes the barriers between data and action, empowering observability, IT and security teams to ensure their organizations are secure, resilient and innovative.
Founded in 2003, Splunk is a global company — with over 7,500 employees, Splunkers have received over 1,020 patents to date and availability in 21 regions around the world — and offers an open, extensible data platform that supports shared data across any environment so that all teams in an organization can get end-to-end visibility, with context, for every interaction and business process. Build a strong data foundation with Splunk.


