
Digital Resilience Pays Off
Download this e-book to learn about the role of Digital Resilience across enterprises.

In distributed microservices environments, DevOps and SRE teams are challenged with the burden of converting metrics, events, logs, and traces from the entire fleet of disparate microservices components into a cohesive and manageable observability system that identifies, debugs and resolves performance issues. The sheer number of components, dynamic and ephemeral nature of container deployments, and the variability in the data formats makes this an extremely complex, ever-changing challenge.
It’s no wonder that monitoring is cited as one of the biggest challenges in adopting distributed architectures according to the latest survey of cloud-native practitioners conducted by the Cloud Native Computing Foundation (CNCF).
Service mesh provides a consistent way to connect, manage, and secure microservices. It manages communication between services, enforces policies based intent, and aggregates telemetry data, all without developers having to make any change in microservices code. Observability is one of the biggest use cases for adopting service mesh as it can provide consistent performance data across microservices.
Service meshes, such as Istio, use sidecar pattern where a set of responsibilities, complementary to the core application functionality, are implemented by sidecars instead of every instance of every microservice. The following diagram shows the using sidecar to implement concerns which are common among microservices:
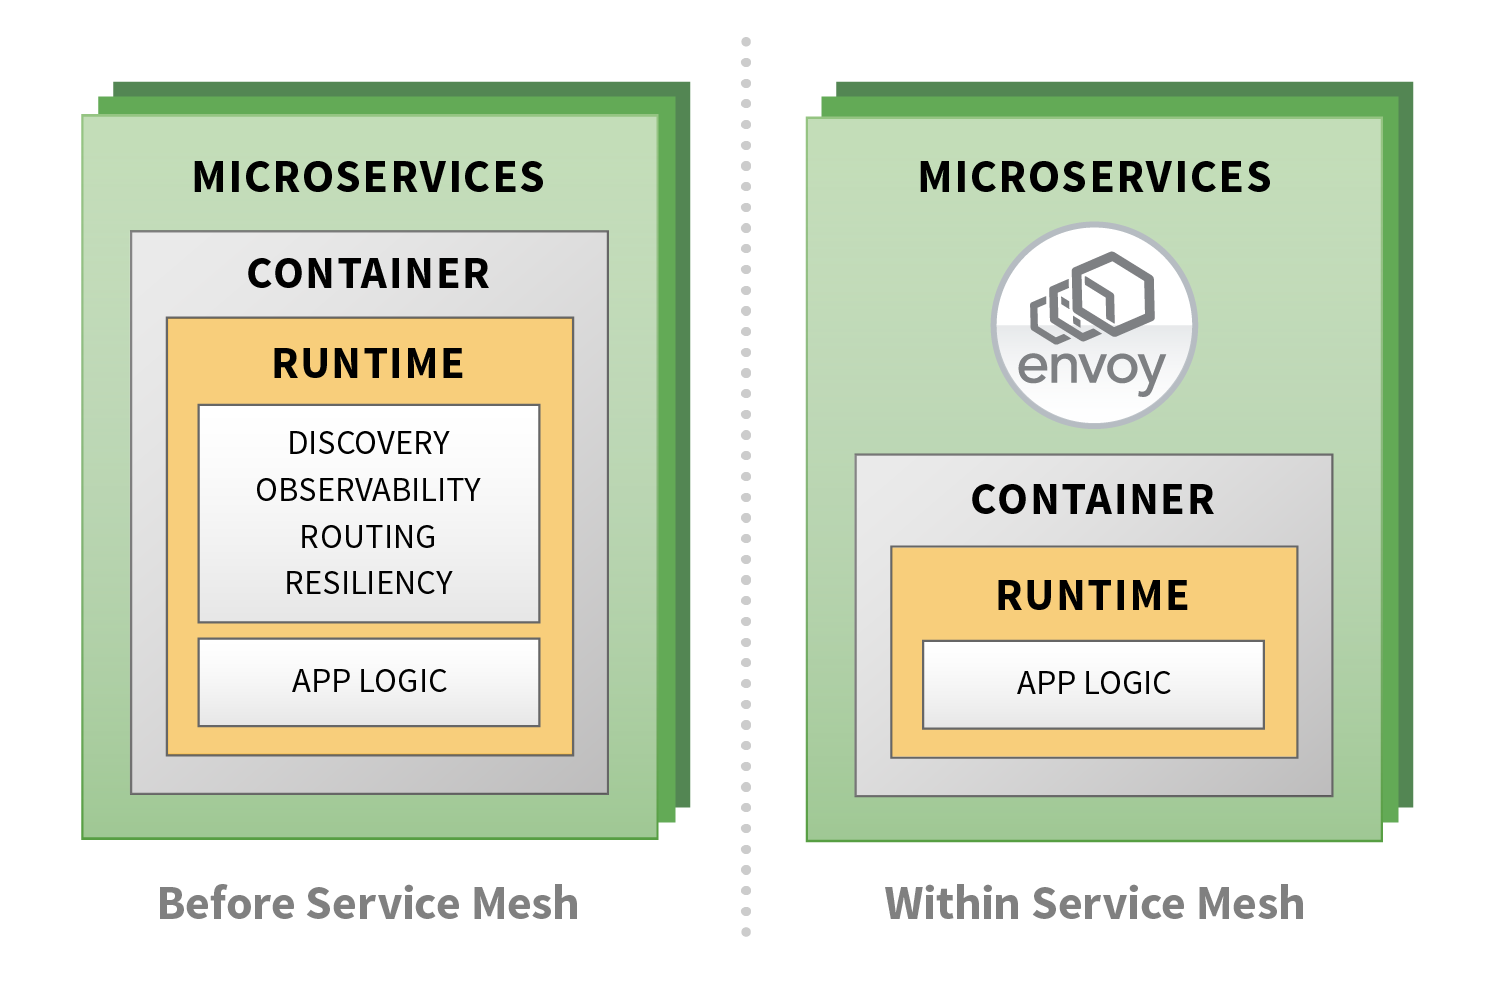
Istio uses Envoy, an open source, high-performance sidecar proxy as the data plane. Envoy intercepts network communications between microservices. Because Envoy proxies sit between every microservices interaction controlling both ingress and egress traffic going into and out of each service, they have complete visibility into the traffic and can support various use cases such as Layer 3/4 filtering, packet inspection, header inspection and manipulation, access logging, rate limiting, statistics capture, and distributed tracing.
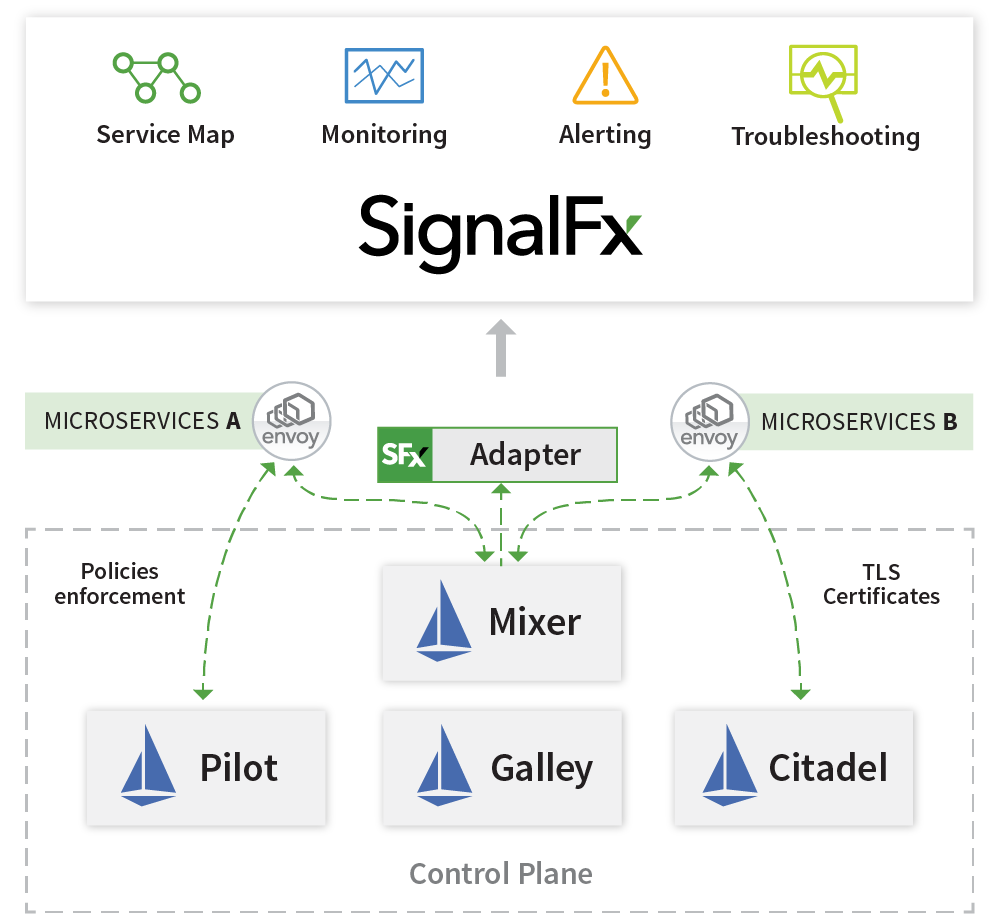
Istio on GKE is an add-on for GKE that quickly creates a cluster with all the components needed for running an Istio service mesh. Next, we look at the control plane components that Istio on GKE add-on installs and maintains:
Creating a cluster is a single step process with Istio on GKE:
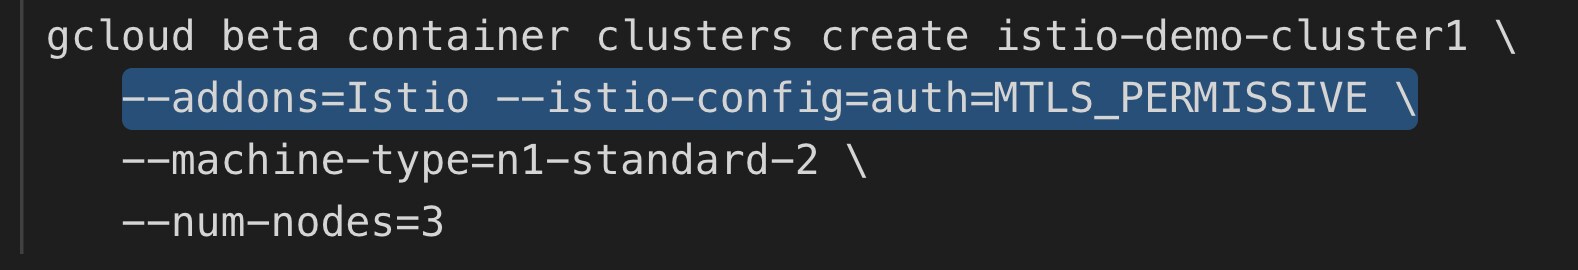
Using permissive mode for Istio authentication policy, microservices deployed on Istio can communicate with the services that have not yet been on-boarded to Istio environments. Strict mode necessitates TLS certificates issued by Citadel. Istio on GKE add-on can also enable sidecar injection to application containers so that the performance data can be captured by Mixer:
kubectl label namespace <<your-namespace>> istio-injection=enabled
Splunk Infrastructure Monitoring has an Istio Mixer adapter that captures metrics and trace spans and seamlessly ingests them into Splunk using a simple installation process via installing Helm chart. Update your environment variables – accessToken or Kubernetes secret key, and Smart Gateway URL in values.yaml file, then deploy the helm chart by running the following command:

You will immediately start to get the benefits of Splunk real-time observability platform:
Customers get visibility and accurate alerting on the performance of their microservices without having to make any change to their application code.
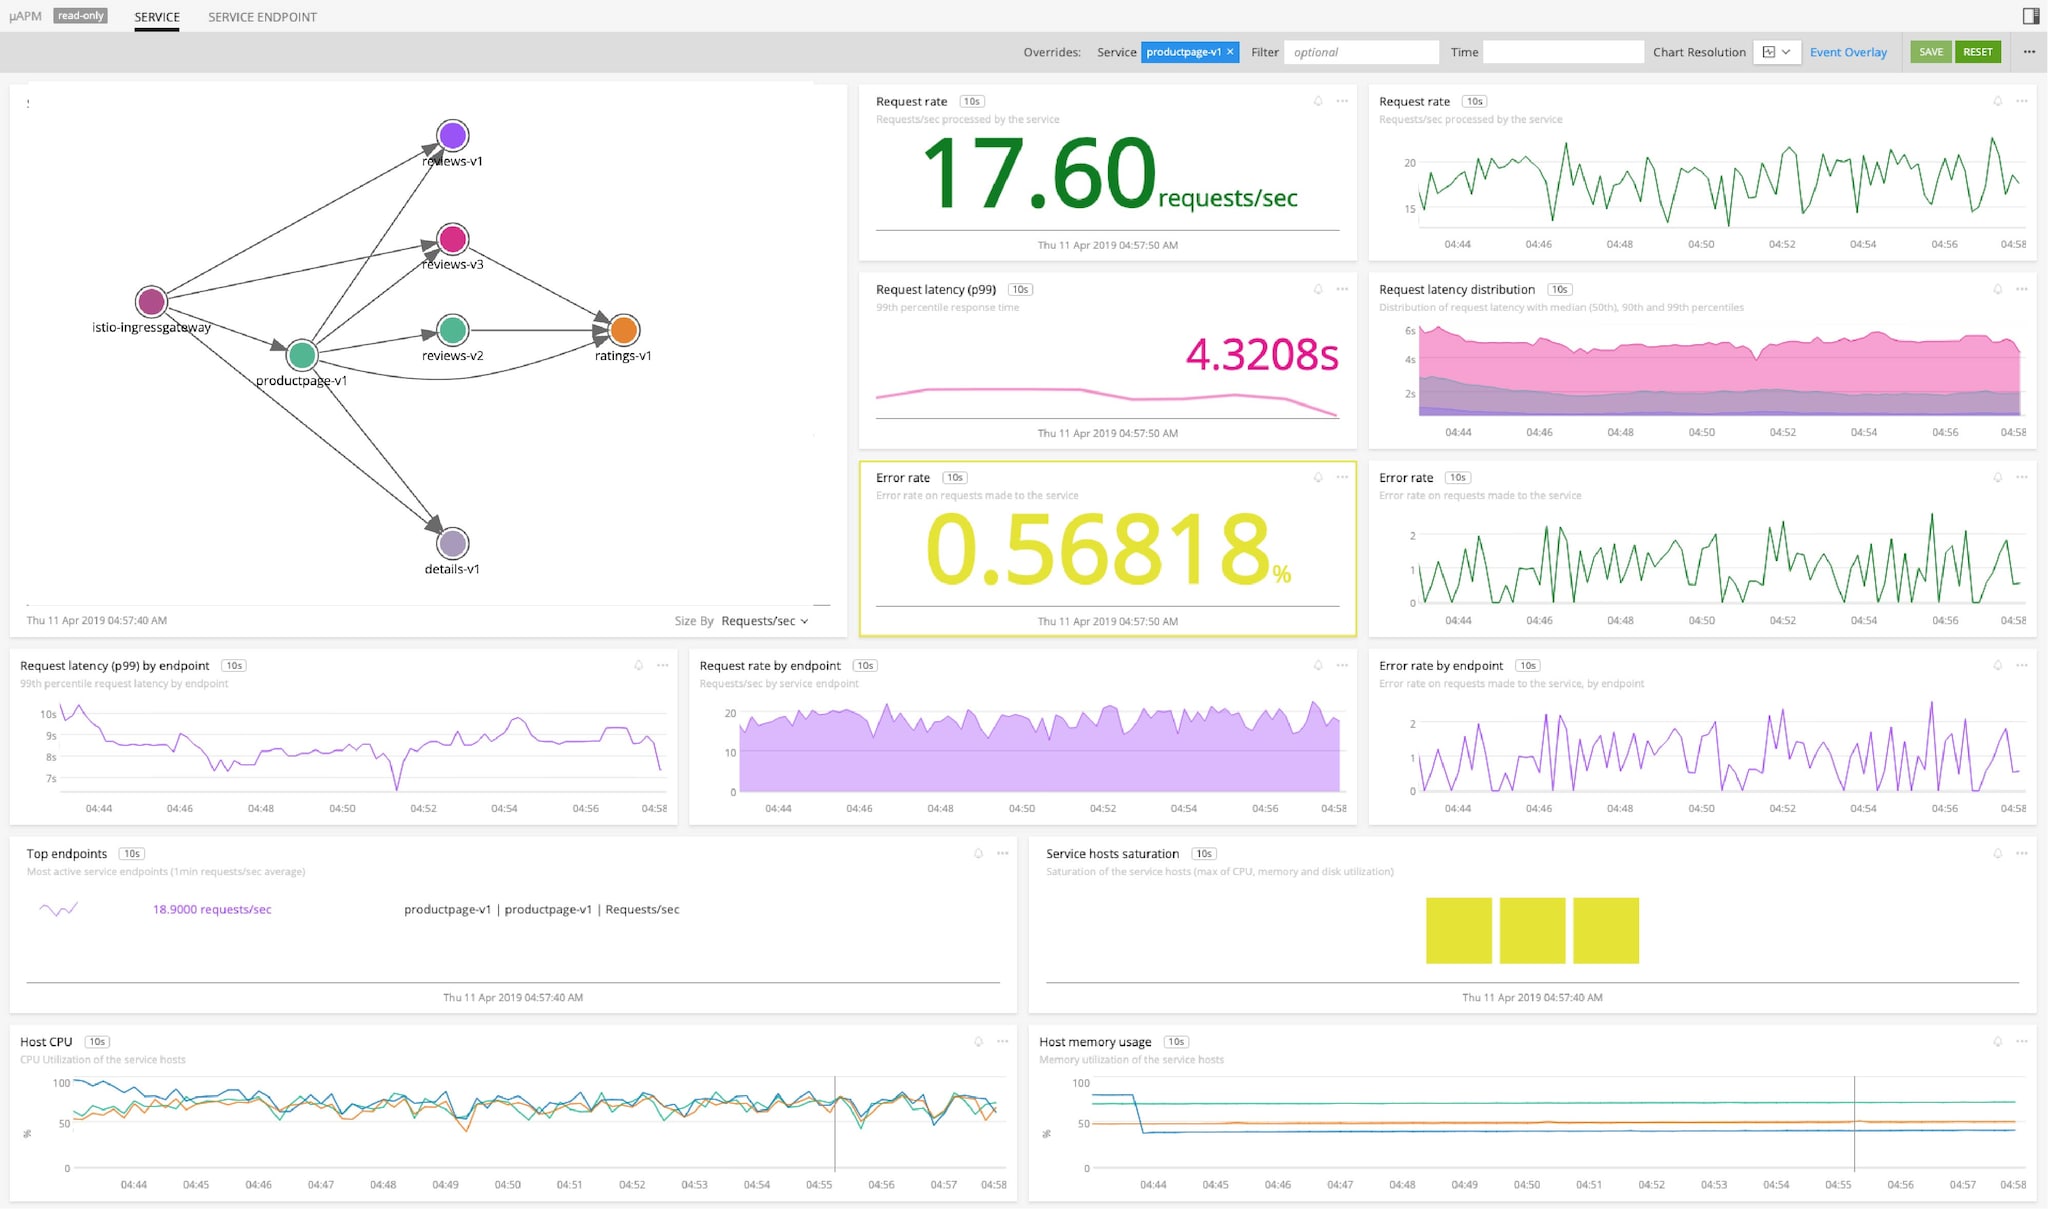
In this example, I have deployed bookinfo application which ships with Istio. Splunk's integration with Istio on GKE automatically captures metrics and traces and provides pre-built service dashboards with accurate performance characteristics such as request rate, error, and duration (RED metrics). Service owners can quickly visualize how their services are performing and create precise alerts to quickly respond to system-wide performance issues.
Splunk reduces MTTR and enables DevOps practices by having a single source of truth across infrastructure, Kubernetes platform, and deployed microservices.
Splunk provides unified monitoring for Google Compute Engine nodes, GKE clusters, pods, Istio on GKE, Docker containers and microservices from a single-pane-of-glass. You can quickly slice-and-dice the relevant data based on namespace, Kubernetes Deployments, or Kubernetes Services. GKE overview dashboard gives insights on the overall health of the cluster.
Istio on GKE accelerates your adoption of service mesh technology which provides a consistent way to capture performance data. Splunk Infrastructure Monitoring is the only solution which analyzes every transaction from Istio, provides out-of-the-box visibility, real-time monitoring and precise alerting on microservices performance. Once outlier transactions are identified, Splunk provides directed troubleshooting to quickly determine the root cause and significantly reduce MTTR.
Get visibility into your entire stack today with a free 14-day trial of Splunk Infrastructure Monitoring.
----------------------------------------------------
Thanks!
Amit Sharma

The Splunk platform removes the barriers between data and action, empowering observability, IT and security teams to ensure their organizations are secure, resilient and innovative.
Founded in 2003, Splunk is a global company — with over 7,500 employees, Splunkers have received over 1,020 patents to date and availability in 21 regions around the world — and offers an open, extensible data platform that supports shared data across any environment so that all teams in an organization can get end-to-end visibility, with context, for every interaction and business process. Build a strong data foundation with Splunk.

Get the latest articles from Splunk straight to your inbox.
© 2005 - 2024 Splunk Inc. All rights reserved.
