
Digital Resilience Pays Off
Download this e-book to learn about the role of Digital Resilience across enterprises.
I’ve had this script kicking around for a while now, but never get around to publishing it… in the interest of getting it done, this post will be brief.
You may be aware that in Splunk 4.1, we introduced a completely rewritten Tailing Processor (the component that handles file monitor inputs). The rewrite included a prototype REST endpoint that provides realtime status of the Tailing Processor’s activities. It can be seen at https://localhost:8089/services/admin/inputstatus/TailingProcessor:FileStatus (on a stock installation), but quickly becomes unreadable with a large number of files being monitored.
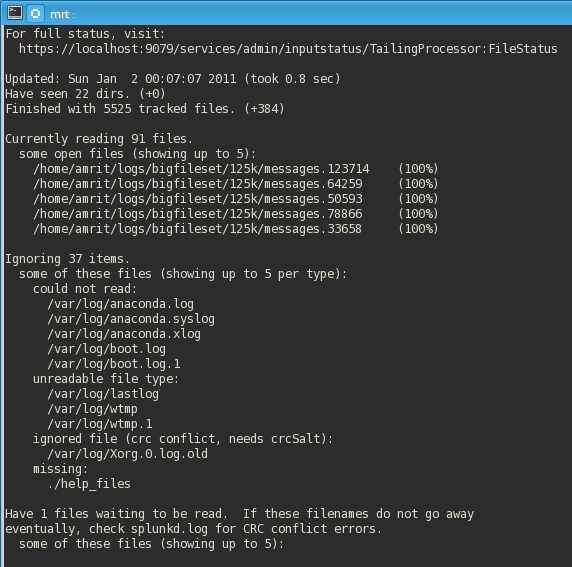
The script (linked below) summarizes all of the entries at the endpoint, as such:
Some quick details about the output:
Things can look a bit more interesting if you catch a large file in progress. Here, we have a ~1GB file at 10% completion – as the tool refreshes, this percentage will adjust accordingly:
![]()
Unix: /opt/splunk/bin/splunk cmd python /path/to/fileStatus.py
Windows: c:\program files\splunk\bin\splunk cmd python c:\temp\fileStatus.py
Better late than never, yes? 
----------------------------------------------------
Thanks!
Amritpal Bath

The Splunk platform removes the barriers between data and action, empowering observability, IT and security teams to ensure their organizations are secure, resilient and innovative.
Founded in 2003, Splunk is a global company — with over 7,500 employees, Splunkers have received over 1,020 patents to date and availability in 21 regions around the world — and offers an open, extensible data platform that supports shared data across any environment so that all teams in an organization can get end-to-end visibility, with context, for every interaction and business process. Build a strong data foundation with Splunk.

Get the latest articles from Splunk straight to your inbox.
© 2005 - 2024 Splunk Inc. All rights reserved.
