Dashboards Beta v0.7: Export Dashboard to PNG/PDF and Self-Service Install for Splunk Cloud
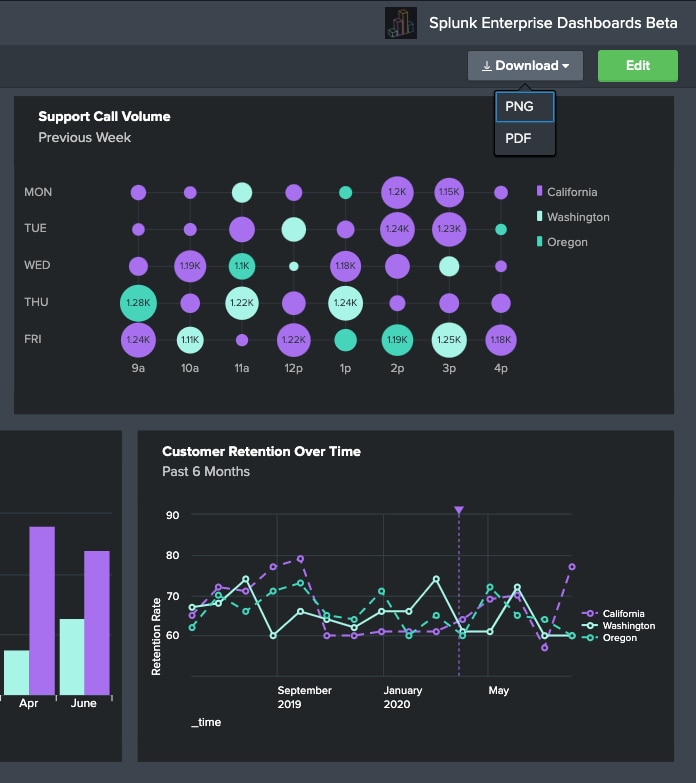
 If you’re new to the Dashboards Beta app on Splunkbase and you’re trying to get started with building beautiful dashboards, this "Dashboards Beta" blog series is a great place to start. The Splunk Dashboards app (beta) brings a new dashboard framework, intended to combine the best of Simple XML and Glass Tables, and provide a friendlier experience for creating and editing dashboards. Read more about this new dashboarding framework, or catch up on previous posts in this blog series about custom SVG choropleth maps and using Grid layout and Saved Searches.
This post will cover how to export your dashboard to PNG and PDF file formats, how to show the "Last Updated Time" on your visualizations, and how to install the app yourself on Splunk Cloud. For notes on every feature, see the release notes on Splunkbase.
Export Dashboard to PDF or PNG
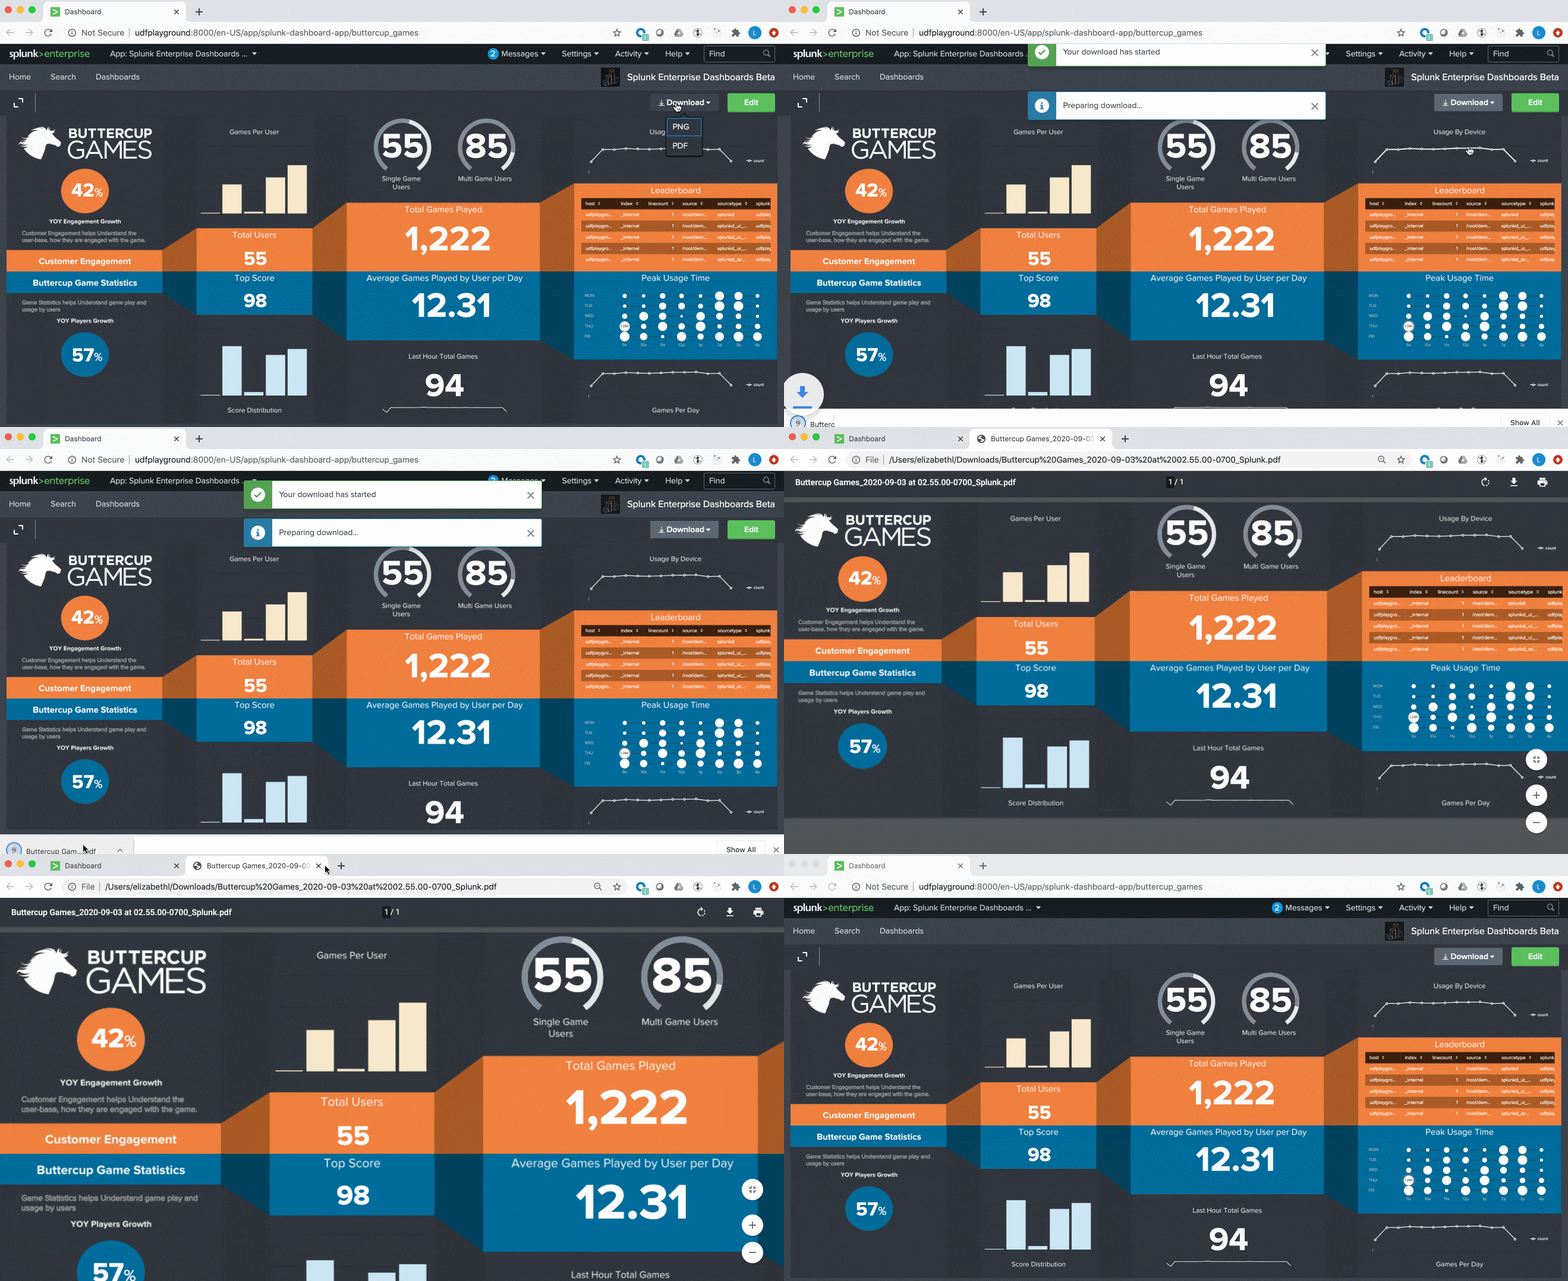
The Splunk Dashboards app (beta) allows you to create visually appealing dashboards that can tell a story or relay important information in a way that’s easy for consumers to understand. With this latest release, you can now export your dashboard to PDF or PNG files to share with others. As you can see in the gif below, the PDF or PNG export will maintain the look and feel of your dashboard.
Show Last Updated Time Using Defaults
You can now display the "Last Updated Time" for a visualization using the showLastUpdated option, similar to the showProgressBar option introduced in the previous blog post for the v0.6 release.

You can use set the showLastUpdated option in the global defaults section or on an individual visualization. In the global defaults section, you can set showLastUpdated both to apply to all visualizations (global) or for specific visualization types. The visualization type setting will supersede the global setting.
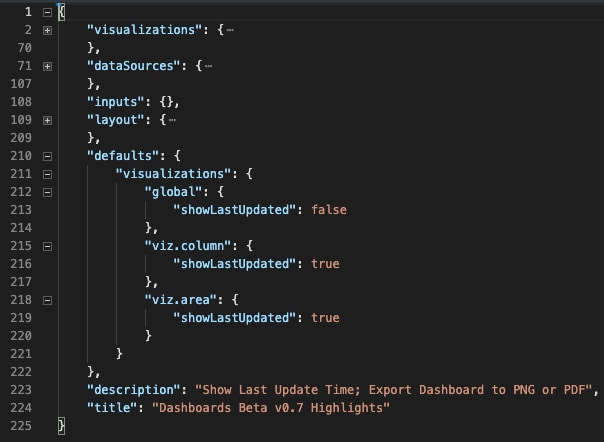
You can also set showLastUpdated setting on an individual visualization, which will supersede both the visualization type and global settings. In the source code snippet above, showLastUpdated has been set to true for column charts. In the source code snippet below, showLastUpdated has been set to false on a specific column chart.
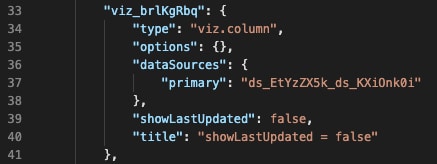
This means that this specific chart will not show the Last Updated Time, as can be seen in the screenshot below.

Splunk Cloud Self-Service App Install
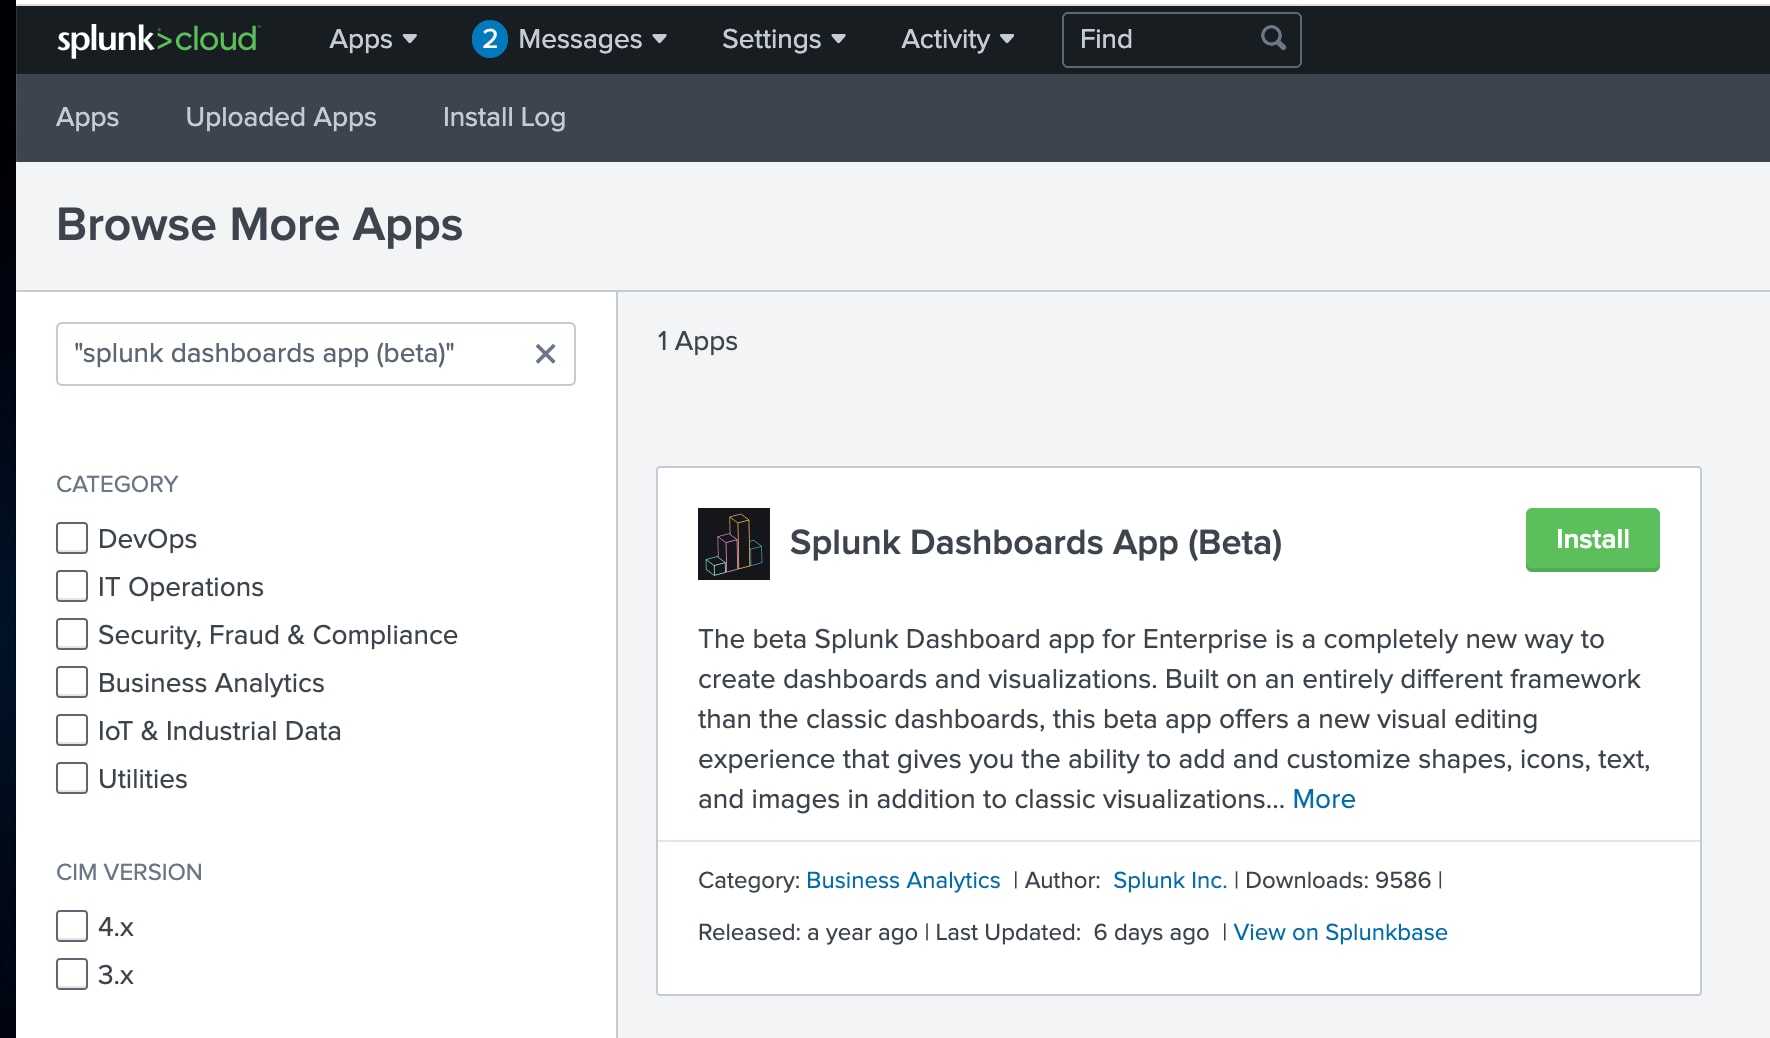
The Splunk Dashboards app (beta) is now available for self service install on Splunk Cloud 7.3 and higher. Search for the Splunk Dashboards app (beta) in the Find Apps section to install. Note: Self-service app installs only work with fresh installs or when upgrading from a version that was also self-service installed. Otherwise, you will need to submit a support ticket. In the support ticket, you can request they make it possible for you to self-service install in the future.
Coming Soon
- UI controls for adding and configuring inputs and tokens
- Ability to use tokens with base + chain and saved searches
- Example visualizations, dashboard settings, and full dashboards
Try out the Dashboards Beta app and let us know if you have any questions, enhancement requests, or bugs to report at dashboards-beta@splunk.com and our team will be sure to respond!
*This information is subject to change at any time, at the sole discretion of Splunk Inc. and without notice. This roadmap information shall not be incorporated into any contract or other commitment. Splunk undertakes no obligation to either develop or deliver any product, features, or functionality described here.
Related Articles
About Splunk
The Splunk platform removes the barriers between data and action, empowering observability, IT and security teams to ensure their organizations are secure, resilient and innovative.
Founded in 2003, Splunk is a global company — with over 7,500 employees, Splunkers have received over 1,020 patents to date and availability in 21 regions around the world — and offers an open, extensible data platform that supports shared data across any environment so that all teams in an organization can get end-to-end visibility, with context, for every interaction and business process. Build a strong data foundation with Splunk.


