
Digital Resilience Pays Off
Download this e-book to learn about the role of Digital Resilience across enterprises.
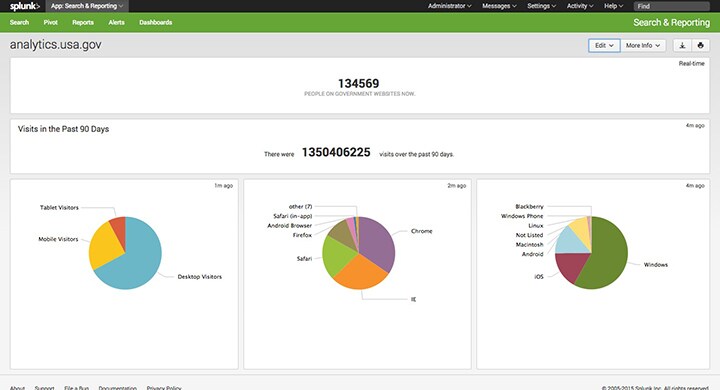
Have you guys seen analytics.usa.gov?
It’s a great break-down of web traffic to various US government sites. I’m a passionate believer in the open-data movement, and this is simply wonderful! A very big pat on the back to the US Government from across the other-side of the Atlantic. I’m now looking at you now Europe…
What’s more, the team that built the app have exposed API endpoints for the data that’s currently being displayed. Which – to my excitement – allows us to start playing with it in Splunk.
I wanted to show you just how easy it is to recreate the site in Splunk, and why you would want to do it in the first place.
I hear you. Why fix something that’s not broken?
Data often becomes much more interesting when you can start to compare it to other datasets and make correlations. One of the things Splunk does well is to easily bring all types of machine data into one place.
For example, if it’s that time of the year we all love when taxes are due to be filed; we could examine the impact it has on the volume of traffic to certain parts of the IRS site.
Also, although near-real time updates are great, using Splunk we can also store the data locally to get a historic view of the data to identify any trends.
Set Up A REST Input in Splunk
To poll the API endpoints on analytics.usa.gov we can install the REST API Modular Input. Grab it here.
You can see a list of the API endpoints available on http://analytics.usa.gov under “download the data”.
Once the endpoints you want have been identified, in the Splunk UI navigate to:
Settings > Data Inputs > REST > Add New
At a very minimum you need to define the fields:
Name: <what ever you like>
 Endpoint URL: <e.g: https://analytics.usa.gov/data/live/realtime.json>
 HTTP Method: GET
 Authentication Type: none
 Polling Interval: <set this to be identical the value the endpoint is updated. e.g if once per minute, set this value as 60 seconds.
 Sourcetype: Manual (dropdown option) > _JSON
Cheat code: To make things quicker, just paste the text in this Gist to inputs.conf (in the location below). This way all the inputs currently available will be automatically configured for you.
$SPLK/etc/apps/launcher/local/inputs.conf
Note, you may need to create the directory and inputs.conf file.
Build A Dashboard Using Search
Wait… 2 things to note before doing this,
Open up the Splunk Search Bar and enter the following queries:
Visitors online now:
sourcetype="_json" source="rest://people online right now 1min"| stats latest("data{}.active_visitors") as "Active Visitors"
Visitors in the past 90 days:
sourcetype="_json" source="rest://visits by desktop mobile tablet devices over 90 days 1day" | stats latest(totals.visits) AS "Total Visits"
Visitor device types in the past 90 days:
sourcetype="_json" source="rest://visits by desktop mobile tablet devices over 90 days 1day" | stats latest(totals.devices.desktop) AS "Desktop Visitors" latest(totals.devices.mobile) AS "Mobile Visitors" latest(totals.devices.tablet) AS "Tablet Visitors" | transpose | rename "column" AS "Device Type" "row 1" AS "Visits" | sort -"Visits"
Visitor OS types in the past 90 days:
sourcetype="_json" source="rest://visits broken down by operating system over 90 days 1day" | stats latest("totals.os.Android") AS "Android" latest("totals.os.BlackBerry") AS "Blackberry" latest("totals.os.iOS") AS "iOS" latest("totals.os.Linux") AS "Linux" latest("totals.os.Macintosh") AS "Macintosh" latest("totals.os.Other") AS "Not Listed" latest("totals.os.Windows") AS "Windows" latest("totals.os.Windows Phone") AS "Windows Phone" | transpose | rename "column" AS "Operating System" "row 1" AS "Visitors" | sort -"Visitors"
Visitor Windows version in the past 90 days:
sourcetype="_json" source="rest://visits broken down by Windows version over 90 days 1day" | stats latest("totals.os_version.7") AS "7" latest("totals.os_version.8") AS "8" latest("totals.os_version.8.1") AS "8.1" latest("totals.os_version.Other") AS "Not Listed" latest("totals.os_version.Vista") AS "Vista" latest("totals.os_version.XP") AS "Vista" | transpose | rename "column" AS "Windows Version" "row 1" AS "Visitors" | sort -"Visitors"
Visitor browser types in the past 90 days:
sourcetype="_json" source="rest://visits broken down by browser over 90 days 1 day" | stats latest("totals.browser.Amazon Silk") AS "Amazon Silk" latest("totals.browser.Android Browser") AS "Android Browser" latest("totals.browser.BlackBerry") AS "Blackberry" latest("totals.browser.Chrome") AS "Chrome" latest("totals.browser.Firefox") AS "Firefox" latest("totals.browser.IE with Chrome Frame") AS "IE (Chrome Frame)" latest("totals.browser.Internet Explorer") AS "IE" latest("totals.browser.Opera") AS "Opera" latest("totals.browser.Opera Mini") AS "Opera Mini" latest("totals.browser.Other") AS "Not listed" latest("totals.browser.Safari") AS "Safari" latest("totals.browser.Safari (in-app)") AS "Safari (in-app)" latest("totals.browser.UC Browser") AS "UC Browser" | transpose | rename "column" AS "Browser" "row 1" AS "Visits" | sort -"Visits"
Visitor IE Version in the past 90 days:
sourcetype="_json" source="rest://visits broken down by Internet Explorer version over 90 days 1day" | stats latest("totals.ie_version.10.0") AS "10.0" latest("totals.ie_version.11.0") AS "11.0" latest("totals.ie_version.6.0") AS "6.0" latest("totals.ie_version.7.0") AS "7.0" latest("totals.ie_version.8.0") AS "8.0" latest("totals.ie_version.9.0") AS "9.0" latest("totals.ie_version.Other") AS "Not Listed" | transpose | rename "column" AS "IE Version" "row 1" AS "Visitors" | sort -"Visitors"
Cheat code: you can copy the XML in this Gist and paste it to create a prebuilt dashboard containing the searches above.
----------------------------------------------------
Thanks!
David Greenwood

The Splunk platform removes the barriers between data and action, empowering observability, IT and security teams to ensure their organizations are secure, resilient and innovative.
Founded in 2003, Splunk is a global company — with over 7,500 employees, Splunkers have received over 1,020 patents to date and availability in 21 regions around the world — and offers an open, extensible data platform that supports shared data across any environment so that all teams in an organization can get end-to-end visibility, with context, for every interaction and business process. Build a strong data foundation with Splunk.

Get the latest articles from Splunk straight to your inbox.
© 2005 - 2024 Splunk Inc. All rights reserved.
