


Digital Resilience Pays Off
Download this e-book to learn about the role of Digital Resilience across enterprises.
You can view mobile-friendly dashboards and interact with augmented reality (AR) visualizations with the Connected Experiences suite of mobile apps. Splunk Mobile, Splunk AR, and Splunk TV allow you to take Splunk data on the go for a secure mobile experience.
Below, Ryan O'Connor from the Splunk for Good team shares some examples of how to build mobile-friendly dashboards. Splunk for Good makes machine data accessible and valuable to nonprofit organizations and educational institutions. Like other users, they want to build mobile-friendly dashboards quickly and easily.
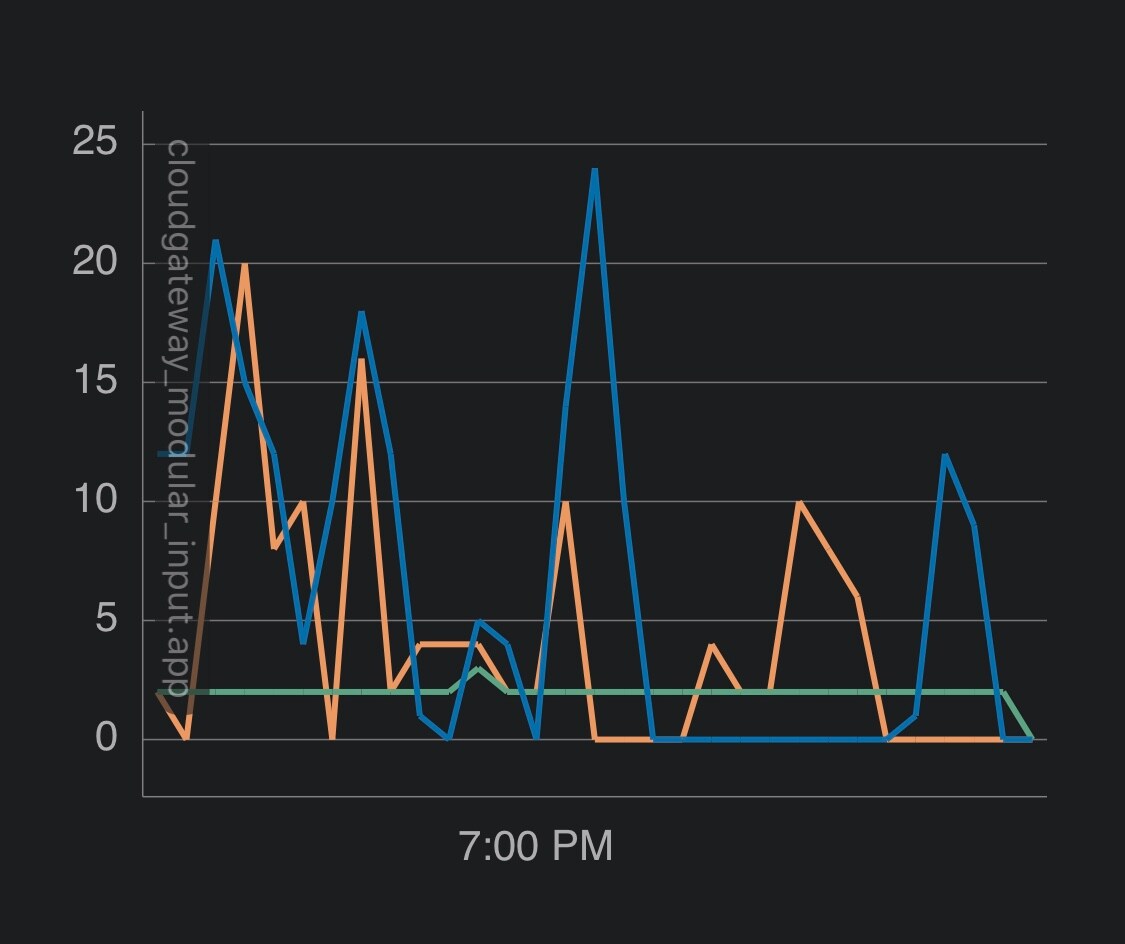
Ryan uses the Analytics Workspace to analyze aquaponics data such as temperature, pH levels, and oxygen at Seattle University and University of Connecticut. The Analytics Workspace is a Splunk platform feature that lets you search your data and create dashboards without needing to know SPL. Here’s a chart that Ryan created to analyze aquaponics data using the Analytics Workspace:
Charts created in the Analytics Workspace aren’t directly supported in the Splunk Connected Experiences apps, because they contain event handlers. Event handlers let you define responses for state changes and user behavior within your dashboard. Although event handlers are a great feature in the Splunk platform, they are currently unsupported in the Splunk mobile apps.
Consider the following example of XML that was created when generating a chart in the Analytics Workspace. The time span dropdown contains the </change> event handler in the dashboard XML:
<input type="dropdown">
<label>Time Span</label>
<choice value="auto">auto</choice>
<choice value="5s">5s</choice>
<choice value="10s">10s</choice>
<choice value="30s">30s</choice>
<choice value="1m">1m</choice>
<choice value="5m">5m</choice>
<choice value="10m">10m</choice>
<choice value="30m">30m</choice>
<choice value="1h">1h</choice>
<default>auto</default>
<change>
<eval token="timechart_span">if($value$ == "auto", "", "span=".$value$)</eval>
<eval token="mstats_span">"span=".$value$</eval>
</change>
</input>
The event handler in the time span dropdown XML generates tokens in the query to respond to user input. The query contains the $mstats_span$ and $timechart_span$ tokens:
<query>| mstats avg(_value) prestats=true WHERE metric_name="temp_f" AND index="seattle_metrics" $mstats_span$
| timechart avg(_value) AS Avg $timechart_span$
| fields - _span</query>
Solution: By default, charts created in the Analytics Workspace have the interactive time control feature enabled. The interactive time control feature connects the chart to a time range picker and a time span dropdown in the dashboard. The time range picker lets you choose how far back to search for data. The time span dropdown creates the $mstats_span$ and $timechart_span$ tokens to control the timespan for each data aggregation.
Here’s what Ryan does to make charts created in the Analytics Workspace display correctly in the mobile app. Disable the time span drop-down list by unchecking the Add interactive time control check box, as shown here:
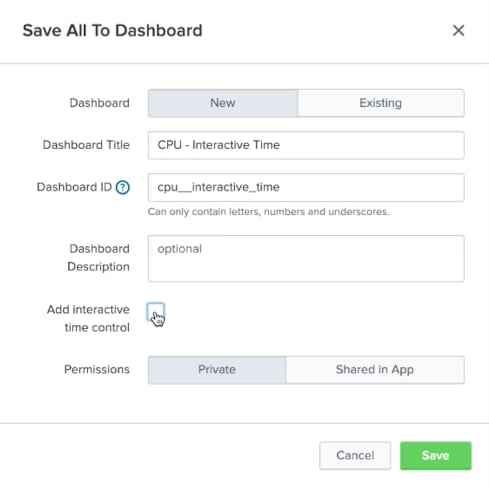
Unchecking the Add interactive time control option removes the $mstats_span$ and $timechart_span$ tokens from the query:
<query>| mstats avg(_value) prestats=true WHERE metric_name="spl.intr.resource_usage.IOStats.data.cpu_pct" AND index="_metrics" span=5m
| timechart avg(_value) AS Avg span=5m
| fields - _span*</query>
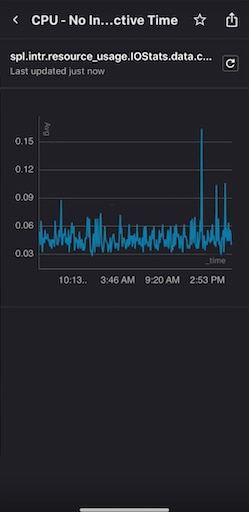
The query no longer references the event handler. The chart now renders in the Splunk mobile apps.
If you want to choose how far back to search your data, see the next tip for how Ryan adds custom time modifiers to dashboard panels.
Occasionally, Ryan needs to build dashboards that date back several years. For example, he wants to see how efficiently a building’s solar array performed in the past two years. As of today, the time range picker in the Connected Experiences apps show 15 minute, 60 minute, 6 hour, 24 hour, 7 day, 30 day, or custom time ranges that take place within the same year. The Connected Experiences apps don't support custom time ranges in the time range picker beyond the current year.
Solution: To search for events beyond 30 days in the time range picker, or beyond the current year, Ryan adds a specific time range to panels in his dashboard. Here are some examples of how to do this.
Specify in the query to search for events from two years ago:
index=main earliest=-3y@y latest=-y@y sourcetype=energy | timechart sum(kwh) span=1y
Specify in the query to search for events between January 1, 2018 and December 31, 2018:
index=main earliest="01/01/2018:00:00:00" latest="12/31/2018:23:59:59" sourcetype=energy
Now charts show data from the time range specified in the query.
The error message, "Unable to fetch data" occurs when loading a dashboard that contains visualizations that aren’t supported by the Connected Experiences app. However, Ryan noticed he also receives this message when he views a dashboard in a Connected Experiences app while someone else simultaneously edits the same dashboard in Splunk Web.
Solution: If you find yourself in the same situation as Ryan, exit the dashboard by navigating elsewhere in the app, then view the dashboard again. This forces a cache refresh and updates the dashboard.
Many organizations use Splunk Enterprise Security to gain security intelligence and want to be able to take security monitoring on the go. Ryan shows how you can configure Splunk Enterprise so that you can send and receive Splunk Enterprise Security alerts on the Splunk Mobile app.
Solution: To send alerts from your Splunk Enterprise Security Correlation Searches, do some prior configuration. In Splunk Enterprise Security, navigate to Configure > General > App Imports Update. Click update_es and add "splunk_app_cloudgateway" to the Application Inclusion List field.
This allows Enterprise Security to access knowledge objects from Splunk Cloud Gateway. Now, you're able to send alerts from your Splunk Enterprise Security instance to Splunk Mobile users.
If you’re running into other issues with the Splunk Connected Experiences apps, see the following documentation that Splunk experts like Ryan use to troubleshoot the apps:
Visualization support for the Connected Experiences apps: A list of supported and unsupported visualizations and configurations for the Connected Experiences apps.
Troubleshoot Splunk Cloud Gateway: Splunk Cloud Gateway is the backend infrastructure for all of the Connected Experiences apps, so if you’re having trouble loading a dashboard, you might need to troubleshoot Splunk Cloud Gateway.
Troubleshoot Splunk Cloud Gateway Connection Issues: Because devices connect to your Splunk platform instance through outbound HTTPS connection, make sure you have HTTPS and websocket connections.
Meanwhile, the Connected Experiences team is actively working on our entire suite of apps to support more Splunk platform features and develop new and exciting features. If you think you have an idea for a great feature, submit it or vote for other features at https://ideas.splunk.com.

The Splunk platform removes the barriers between data and action, empowering observability, IT and security teams to ensure their organizations are secure, resilient and innovative.
Founded in 2003, Splunk is a global company — with over 7,500 employees, Splunkers have received over 1,020 patents to date and availability in 21 regions around the world — and offers an open, extensible data platform that supports shared data across any environment so that all teams in an organization can get end-to-end visibility, with context, for every interaction and business process. Build a strong data foundation with Splunk.

Get the latest articles from Splunk straight to your inbox.
© 2005 - 2024 Splunk Inc. All rights reserved.
