
Digital Resilience Pays Off
Download this e-book to learn about the role of Digital Resilience across enterprises.
Data Stream Processor (DSP) version 1.1 brought in some cool new features. One of which was the ability to receive events over HTTP.
You’re probably familiar with Splunk’s HTTP Event Collector which works in a similar fashion, but has the added advantage of running across a Kubernetes cluster. So, if you’ve got a bunch of heavy forwarders whose only job is to collect these HTTP events and send them onto Splunk, this blog is probably for you!
Splunk DSP is a data stream processing service that processes data in real-time and sends that data to your platform of choice. During the processing stage, the Splunk DSP allows you to perform complex transformations and troubleshooting on your data before that data is indexed.
High-level view of current supported DSP sources and sinks - the ones we use in this blog are highlighted.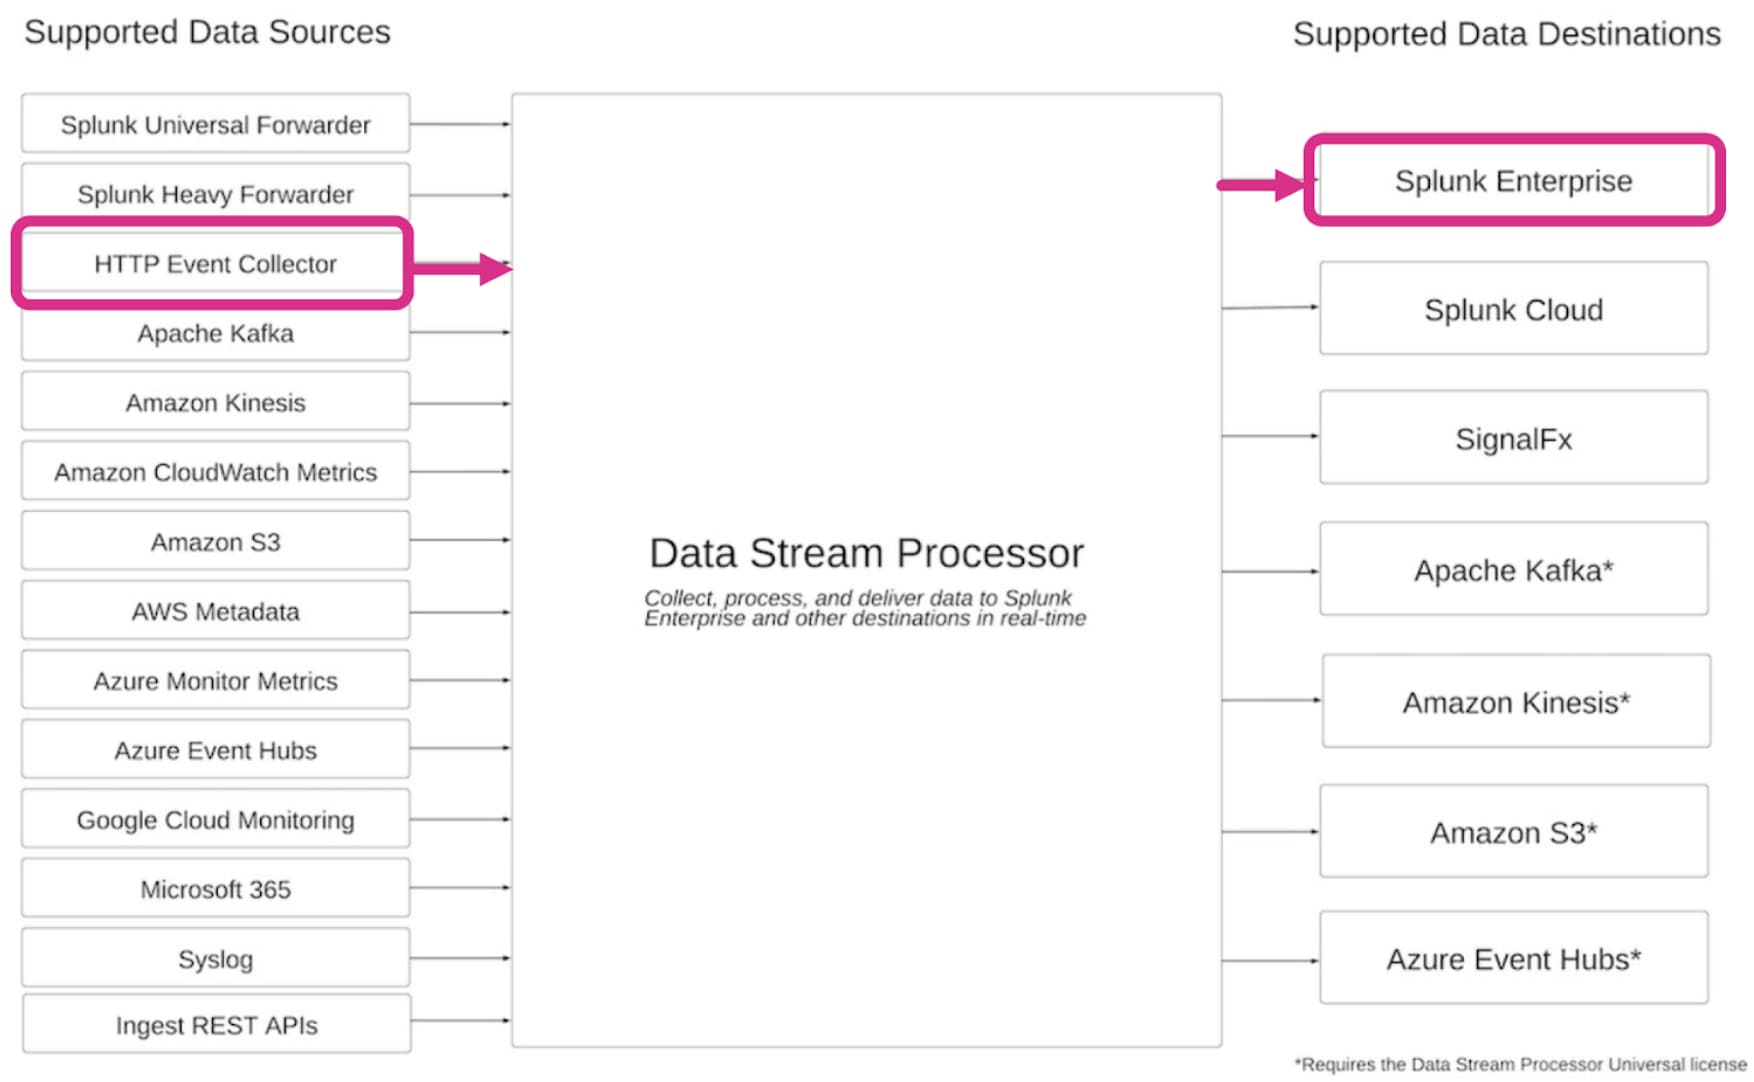
Note: scloud version 3 or greater is required for this step!
Start by running ./scloud login to ensure everything is working, if you receive no errors, you can run the following to generate a HEC token:
./scloud ingest post-collector-tokens --name testtoken --tenant default
You will get a message back with your token details - Note: Save these! You can’t retrieve tokens from the system!
Your token has been created, and you can now use it to send HTTP Events to your endpoint. In this case, it’s https://dsp.example.com:31000/services/collector/event.
In fact, you can use the command line and curl if you prefer, I just use Postman as it will form my requests into scripts for me easily.
Create a POST request in Postman, under “Headers”, set the Authorization header to your DSP HEC token prefixed with Splunk.
Note: Ignore the Auth tab, we’re not using that.
Next, click on the "Body" tab, select “raw” from the dropdown below and select “JSON”. This is where we’re going to create our event. I used this as an example:
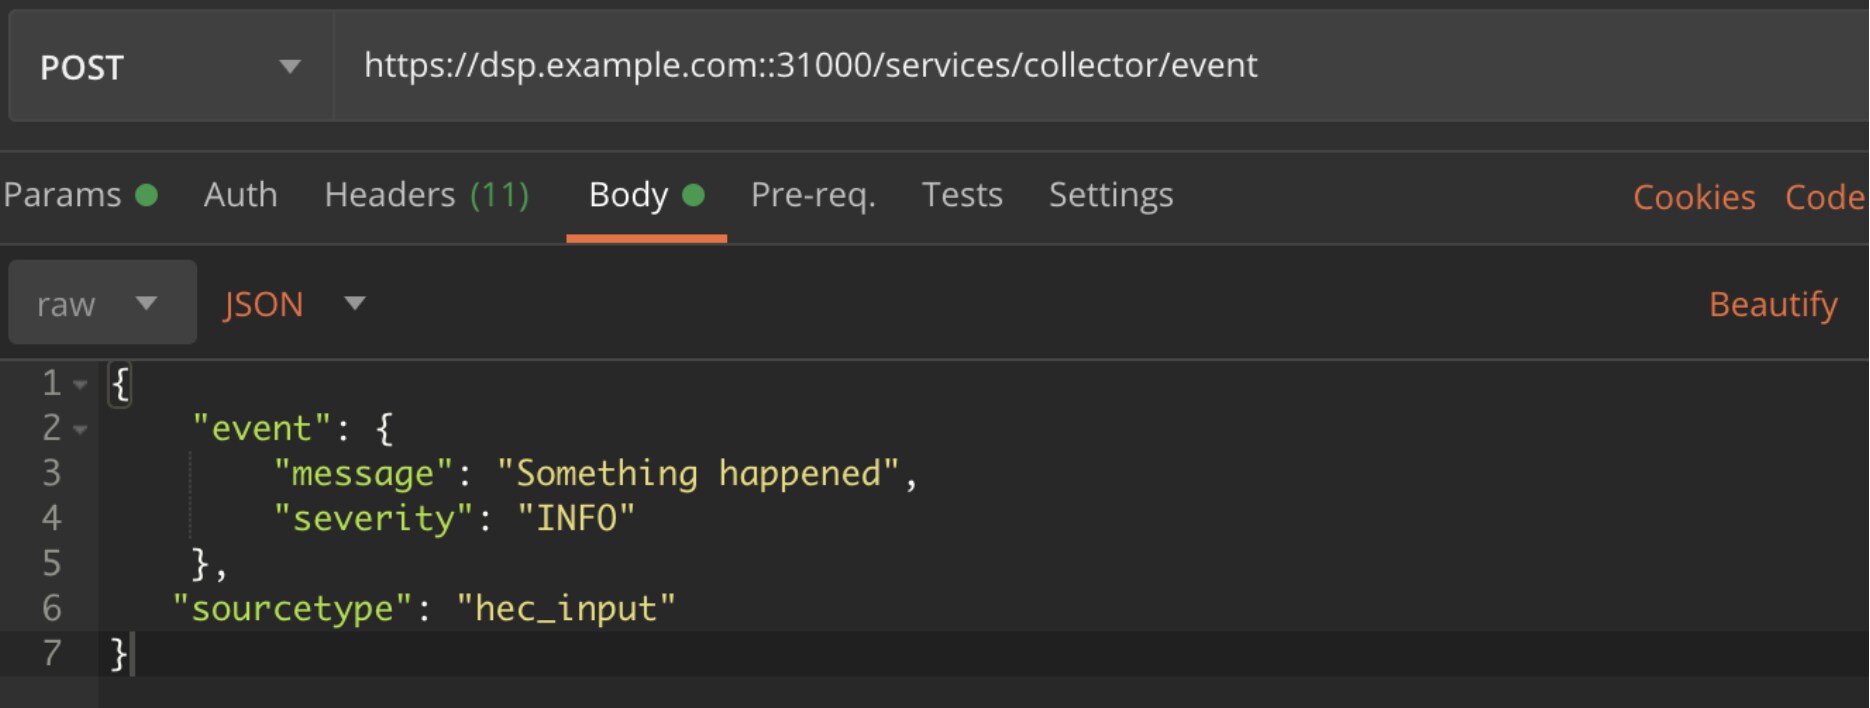
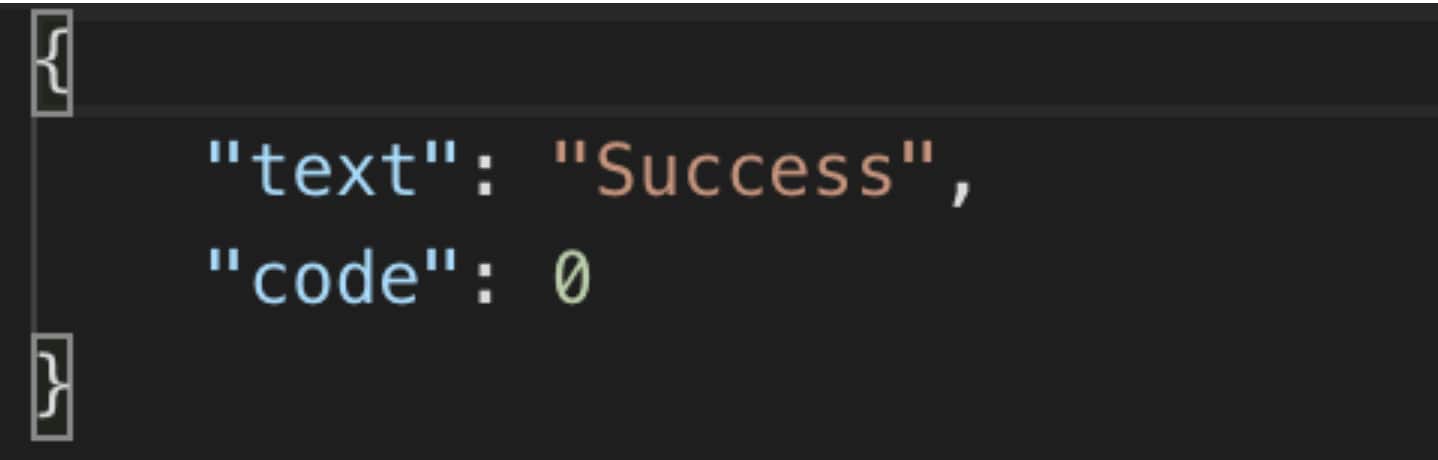
Hit "Send", and you should be rewarded with a "Success" message.
Once you get the "Success" messages, keep Postman open. As when we build, preview and activate the DSP Pipe, we’re going to need to hit "Send" again a few more times.
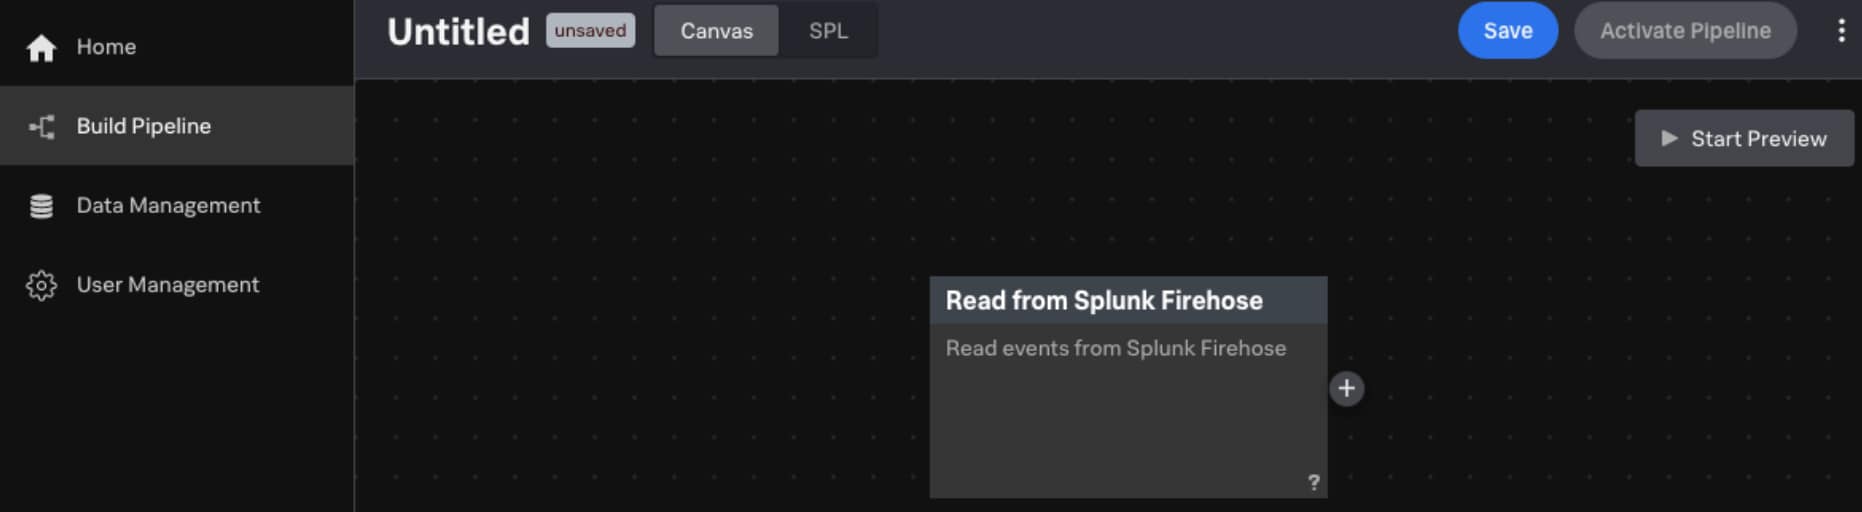
Head over to DSP and log in. Navigate to “Build Pipeline”, and select “Read from Splunk Firehose”. You should have this:
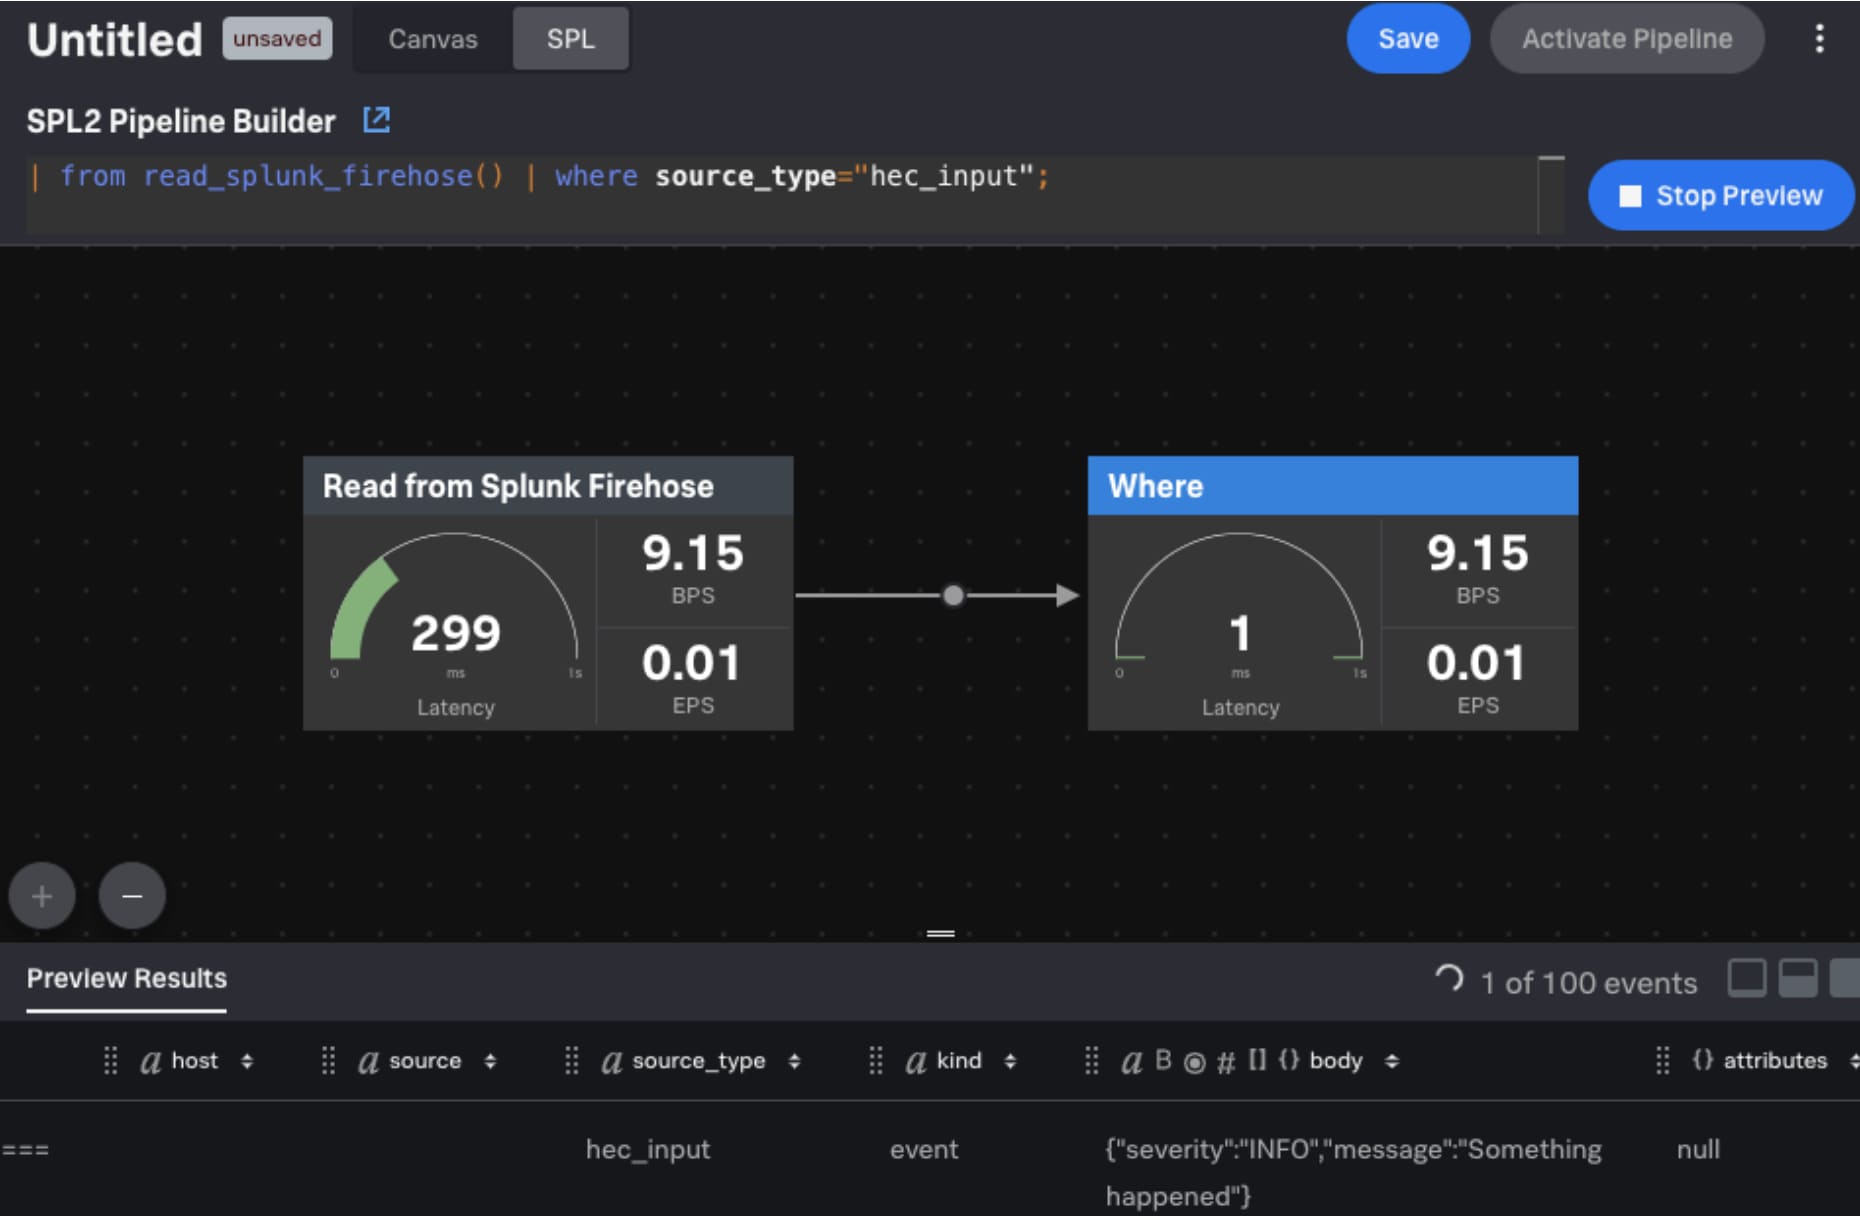
Next to "Canvas" at the top, click "SPL". If your environment is like mine, it already has some data coming in from various universal forwarders. In order to see the HEC event, we need to add a “where” statement straight away.
After the “| from read_splunk_firehose()” source, add “| where source_type=”hec_input”;”. It should look like this:
| from read_splunk_firehose() | where source_type="hec_input";
Note: The semicolon goes at the end!
Click "Start Preview" and click the “Where” function in the pipe that gets created by the SPL. You should see that it’s “Polling for events to preview”. Head back to Postman and hit “Send”. You’ll see the event appear in DSP like below.
So now you’ve previewed the event in DSP, it’s time to send it into Splunk. If you’re still previewing for data, click "Stop Preview".
It’s probably easier to use the Canvas to do this. So click the “Canvas” tab.
On the right-hand side of the “Where” function, click the + button. A menu will appear on the right to add a new function. Type Splunk in the search bar and select “Write to Splunk Platform”.
I am assuming that you’ve already connected DSP to Splunk, but in case you haven’t, follow the guide here.
In the “View Configurations” section of the “Write to Splunk Enterprise” sink, select the connection_id for your Splunk deployment, type the index you want to send to, in this case I’m using “main”, and type null in the payload box as we don’t need this. If you now click the “SPL” tab, it should look something like this:
| from read_splunk_firehose() | where source_type="hec_input" | into splunk_enterprise("e4671bf2-119c-4b9c-8e84-29485cfe52ff", "main", null);
Hit “Save”, give your pipe a name and a description, save it and then click “Activate Pipe”. Give it a few seconds, then head back to Postman and hit the “Send” button a few more times. Remember: You should always be rewarded with that success message.
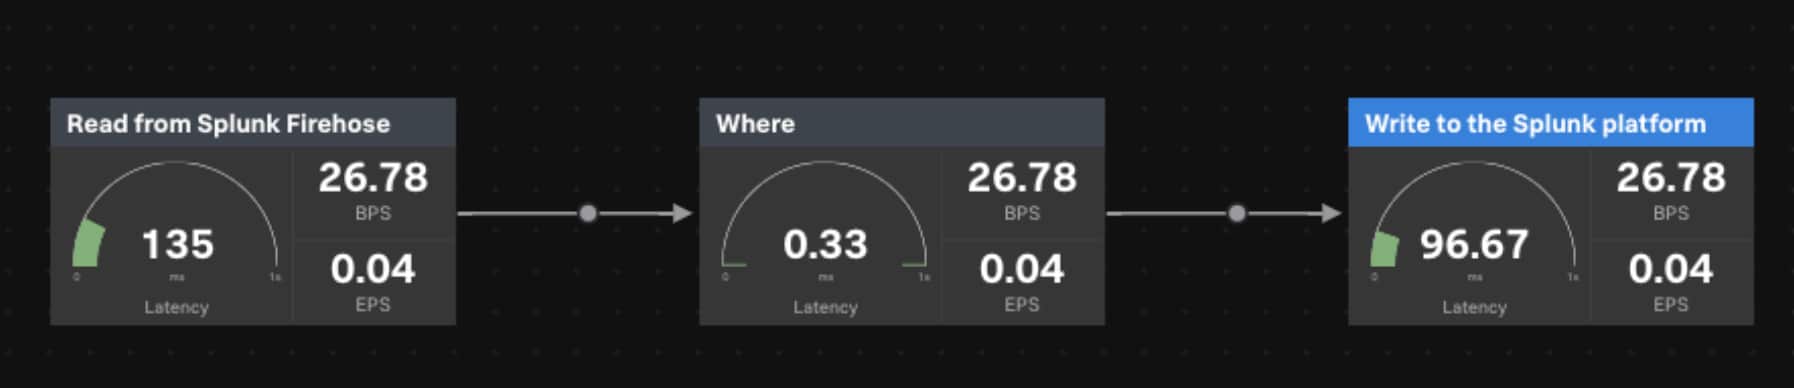
Your activated pipe should be similar to this:
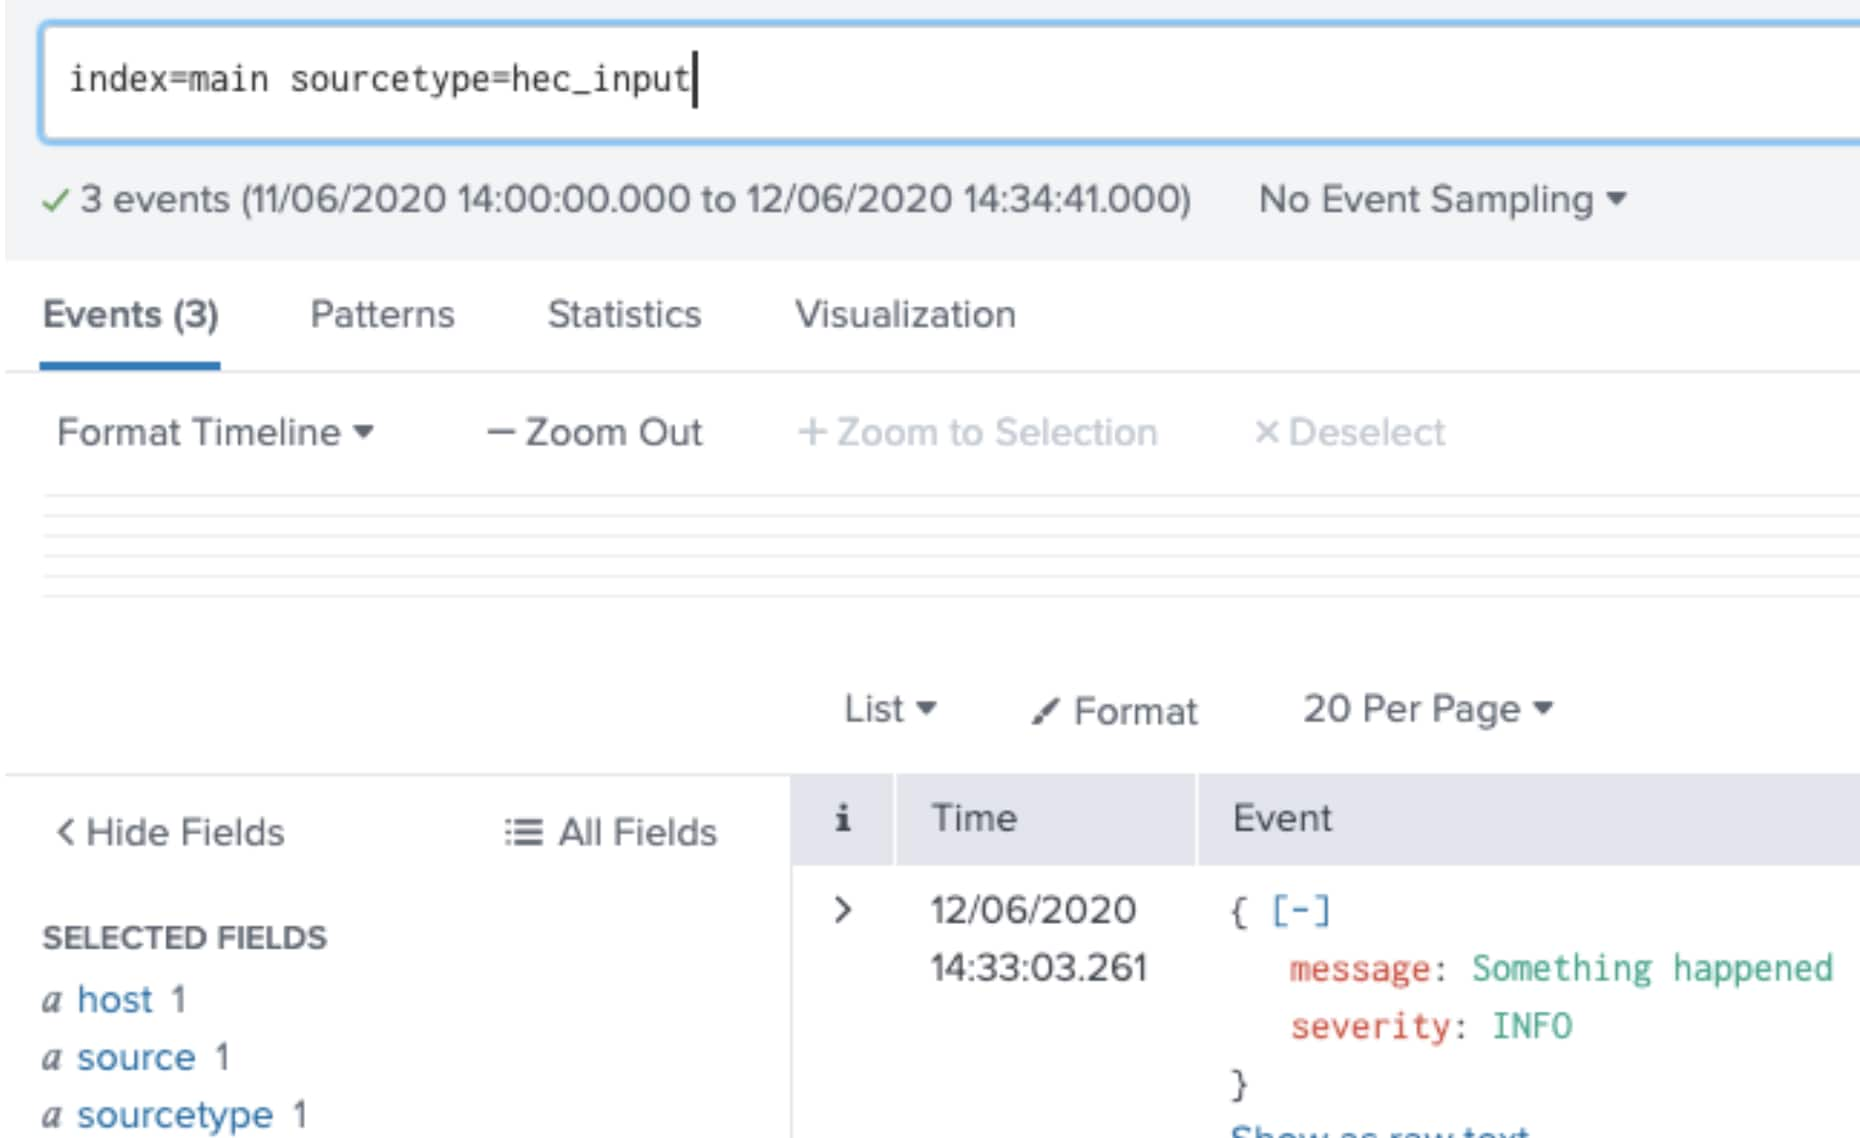
Head over to Splunk, and search index=main sourcetype=hec_input and voila! You will see your events.
Comprehensive documentation is available for DSP here.
If you’re interested in learning more about DSP in general, please contact your Splunk sales representative.
Happy Streaming!
The Splunk platform removes the barriers between data and action, empowering observability, IT and security teams to ensure their organizations are secure, resilient and innovative.
Founded in 2003, Splunk is a global company — with over 7,500 employees, Splunkers have received over 1,020 patents to date and availability in 21 regions around the world — and offers an open, extensible data platform that supports shared data across any environment so that all teams in an organization can get end-to-end visibility, with context, for every interaction and business process. Build a strong data foundation with Splunk.

Get the latest articles from Splunk straight to your inbox.
© 2005 - 2024 Splunk Inc. All rights reserved.
