
Digital Resilience Pays Off
Download this e-book to learn about the role of Digital Resilience across enterprises.
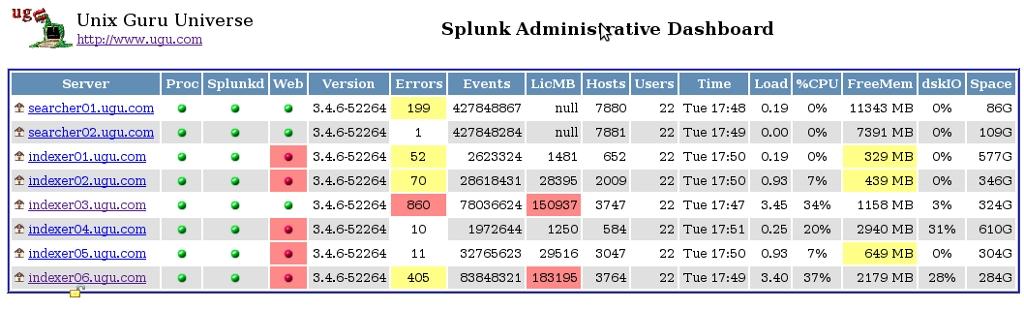
I was recently given access to an open source tool called spdash. This tool allows you to externally visualize Splunk health from an Administrative standpoint. It consists of some cgi code and leverages a set of scripts (checksplunk) that grabs health information from one or more Splunk instances. Information such as basic process status, listings of event counts, user specific search counts, and error messages are all presented in an intuitive screen. Check out the main dashboard page:
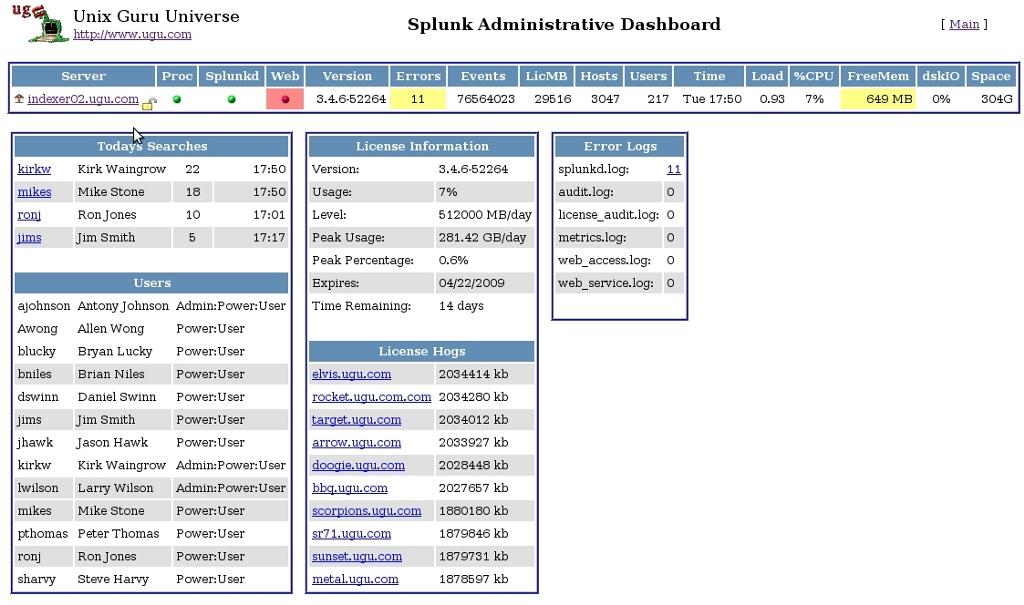
After installing and running it internally on some of our systems, I have come away very impressed with what this can do for the System Administrator of a Splunk instance. One of the great features is the server link which allows you to get specific server information. Here is a screen capture of that screen:
When I first saw this being developed, I thought that it might be challenging to deploy. After less than an hour, I had a handful of servers sending and updating data to this dashboard. Now it’s no cakewalk, but it’s pretty straighforward. If you are very familiar with Splunk, have scripting experience, and can manage cgi on a web server then you should have no trouble. Kudos to the author, Kirk Waingrow, for making this available to the general public! If you are a System Administrator and manage Splunk, I would highly recommend you check this out.
I will post a follow up that will contain details on my deployment…
----------------------------------------------------
Thanks!
Simeon Yep

The Splunk platform removes the barriers between data and action, empowering observability, IT and security teams to ensure their organizations are secure, resilient and innovative.
Founded in 2003, Splunk is a global company — with over 7,500 employees, Splunkers have received over 1,020 patents to date and availability in 21 regions around the world — and offers an open, extensible data platform that supports shared data across any environment so that all teams in an organization can get end-to-end visibility, with context, for every interaction and business process. Build a strong data foundation with Splunk.

Get the latest articles from Splunk straight to your inbox.
© 2005 - 2024 Splunk Inc. All rights reserved.
